Live Videos Now Stand For 20% Of All Facebook Videos
— May 24, 2017
“We had a good start to 2017”, said Mark Zuckerberg, Facebook founder and CEO, about the results for the first quarter of the year.
In this post, we will look at the announced results and the other news from the world of Facebook.
We will also look at the page likes growth and post engagement stats from the 5,000 pages in our study.
Let’s get started.

Results from Q1
1.28 billion people use Facebook every day, while monthly active users are up have reached 1.94 billion. This is an 18% increase year-on-year on daily active users and 17% increase in monthly active users. 1.2 billion use Facebook Messenger monthly.
Advertisers spent 51% more in the first quarter ($ 7.85 billion in total) compared to the previous year, and the company served 32% more ad impressions thanks to its efforts to block the adblockers. 85% of all revenue comes from mobile advertising.
More than 5 million businesses are advertising on the platform every month. This number was at 3 million in March last year and at 4 million in September last year.
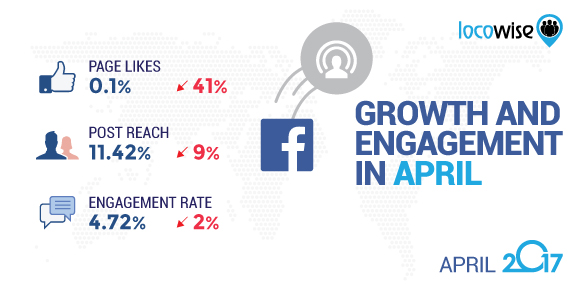
Growth and engagement in April
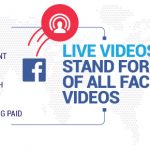
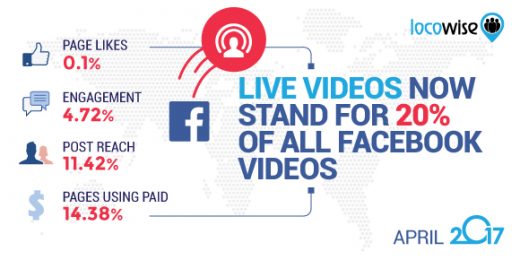
Page likes growth in April was at 0.1% of the total audience. Page likes growth has seen a 41% decrease compared to March and it’s the lowest page growth we’ve seen since May 2015 when we started doing our studies.
An average post reached 11.42% of the page audience in April. This is 9% lower compared to March but the post reach is continuing its good performance since that great 39% bump we saw in February. There might be more good news for post reach. Facebook has debuted “Latest Conversations” feature within its search results that lists posts about timely topics. This feature could allow those pages that post about timely topic to reach a new audience.
Post engagement rate in April was at 4.72% of people reached, which is a 2% decrease compared to March.
14.38% of pages we looked at used Facebook Advertising in April paying for 33.37% of their total reach.
Live videos now stand for 20% of all Facebook videos
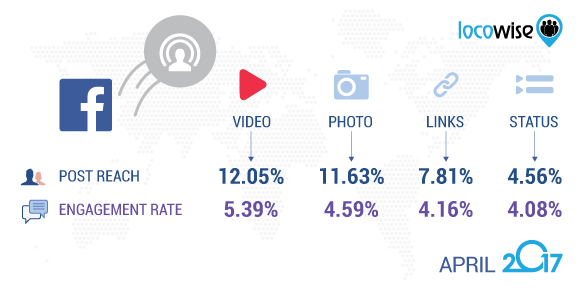
Video continues to be the king of post formats.
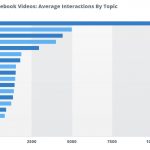
An average video post in April reached 12.05% of the total page audience, while photos reached 11.63%, links 7.81%, and status updates only 4.56%.
Videos also engaged the most people. An average video post engaged 5.39% of people reached, photos engaged 4.59%, links 4.16%, and status updates 4.08%.
Fidji Simo, Facebook’s head of video, has announced that 20% of all Facebook videos are live broadcast and that the daily watch time for live videos has grown by more than 4x in the last year:
“We’ve focused on making the Facebook Live experience more engaging, more fun, and more social. We’ve added live masks and new creative effects, built features that give publishers more control and flexibility over their broadcasts, and rolled out exciting new formats like Live 360 or Live Audio. And now, one in every five Facebook videos is a live broadcast – and over the past year, daily watch time for Facebook Live broadcasts has grown by more than 4x. Every day, we get to enjoy new use cases for Live that we would never have thought about.”
Summary of our latest Facebook video study
Facebook is also launching a new ad type called Collection. It allows marketers to add product images to a video ad in news feeds. When the image is clicked, the user gets to see the product catalogue on Facebook and can from there click on to buy the product on the brand’s website.
Our latest Facebook video study was published in April too and it looked at the video activity in the first quarter of the year. In case you missed it, these are the main findings:
- 96.9% of all videos published were native Facebook videos, 3% were YouTube videos, and 0.1% were Instagram videos.
- 64% of pages we looked at published 10 or fewer videos in the first quarter of the year.
- 14% of all video views were paid for using Facebook advertising and 67% of all pages paid for at least one video view during the quarter.
- The average length of a video published in the first quarter was 3 minutes and 48 seconds, but the average time watched was only 10 seconds or only 4% of the full video length.
- Only 7% of all video views were clicked to play sound. In other words, 93% of all video views we looked at were auto-played as users scrolled through their news feeds and didn’t have any sound on.
Digital & Social Articles on Business 2 Community
(22)