Report: 2016 holiday quarter saw highest rate of digital influence on store visitation
Cuebiq report offers online-to-offline benchmarking metrics for nine verticals.

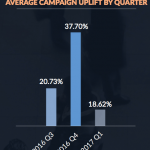
The fourth quarter of 2016 saw a significant uplift in physical store visits coming from digital campaigns.
That’s according to location data and analytics company Cuebiq, which just released a benchmarking report for offline visits driven by digital campaigns. In it, the company offers metrics on daily visit averages, dwell times and campaign uplift ranges in nine verticals.
The data come from Cuebiq clients and were collected between Q3 2016 and Q1 2017. Campaign uplift is determined using a “control/exposed” methodology, which other providers also use to determine impact on store visits:
Uplift measures the impact of ad exposure in driving in-store visits. It is determined by comparing two groups of users: those who saw the ad campaign (the exposed group) and those users who did not see the campaign (the control group). If more users from the exposed group went to an advertisers’ desired point of interest (POI) compared to the control group, then there will be a positive uplift. Conversely, if more control group users went to the POI, the campaign had no impact on store visits.

The growth in Q4 makes sense because of holiday shopping and seasonal consumer receptiveness to marketing messages, which often include discounting and time-sensitive offers.
Cuebiq also determined average visit lengths (dwell times) and most popular visit times during the day for locations in a range of verticals.
In the chart below, Travel includes hotels and airports. Financial includes banks and insurance. Entertainment includes movie theaters, sports venues and concerts. The time associated with the Entertainment category doesn’t entirely make sense, given that movies, sporting events and concerts are generally longer than 38 minutes.

Cuebiq also presents a daily average visit rate for each of these categories. Each of the percentages in the chart below is “based on the daily percentage of the US population that visits certain POIs on weekdays and weekends.” In other words, 1.31 percent of the US population visits a car dealer on an average weekend.
Notwithstanding all the hysteria around the “retail apocalypse,” smaller retail stores (apparel, accessories, footwear, consumer electronics, home, toys) have the highest visit rate of any of the categories measured. Again, this is percentage of the population in one of these types of stores on a given day or weekend.

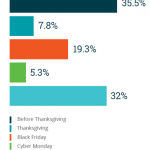
Finally, the report offers campaign performance ranges by category. The figures below represent the store visitation uplift spectrum. Scores at the lower end represent below-average performance and at the upper end, “exceptional performance.” The range in the middle is the average.
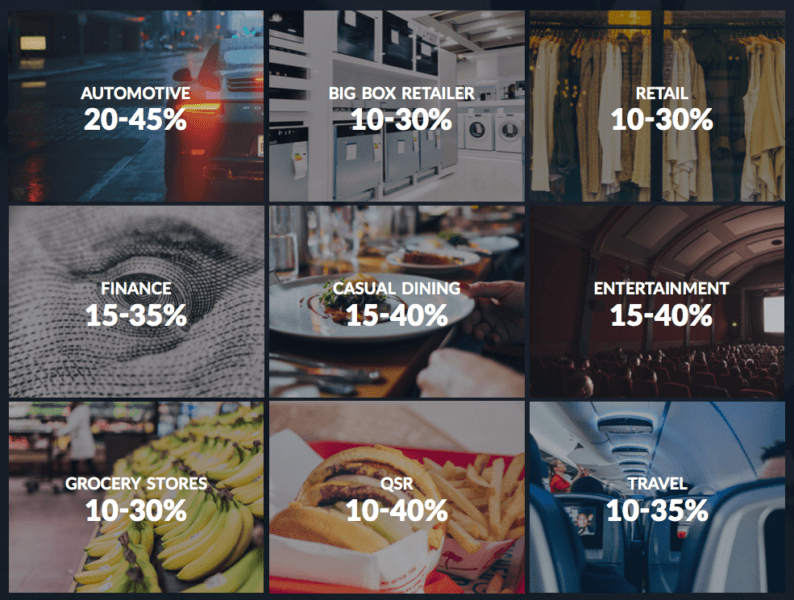
The report is intended as a set of benchmarks for businesses and marketers in the various identified categories against which to measure their traffic and campaign performance. It also offers a number of case studies by vertical. The full report can be accessed here (registration required).
[Read the full article on MarTech Today.]

Marketing Land – Internet Marketing News, Strategies & Tips
(25)