![Social Media Growth from 2010 – 2015 [Infographic]](https://www.devicedaily.com/wp-content/uploads/2016/02/social-media-small-header-300x143.png-520x248.png)
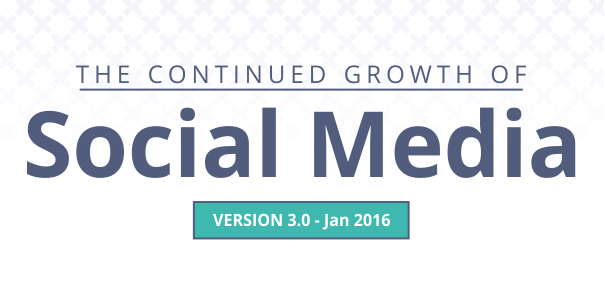
Social Media Growth from 2010 – 2015 [Infographic]
February 15, 2016

In 2011, Search Engine Journal published their first report on social media growth. The in-depth feature offered early insights into social media growth and usage patterns at a time when marketers had fewer analytics capabilities and research at their fingertips.
This month, SEJ has released their third infographic on social media growth, examining the 2010–2015 period. That infographic is shared below in this post. While there are many data trends to examine, perhaps the most important is the rise of mobile.
Fast Facts: Social Media Growth
Search Engine Journal reminds us that there are 3 billion internet users globally, nearly 45% of the world’s population. Of these people:
- 1 billion people have social media accounts
- 7 billion people have active social media accounts
And how are these people accessing the web? On their “phone,” a term that becomes increasingly less relevant with every new iteration of the technology. This past May, Google reported that “more Google searches take place on mobile devices than on computers in 10 countries including the US and Japan.”
Before that–in 2014–the number of mobile users worldwide overtook the number of desktop users, a disparity that continues to increase today. In April 2015, around the same time of the Google report cited above, mobile-only users surpassed desktop-only users, an event that occurred rapidly–that is to say, less than two years ago desktop-only users accounted for 19.1% of single platform users, while mobile-only users were a mere 10.1%.
Mobile Access of Social Networks
Back to the SEJ report…here are the latest trends in how users access social:
- 68% mobile vs. 32% desktop
- Phone penetration is 75% among 18-34-year-olds (2014 growth of 50%)
- 86% mobile vs. 14% desktop
- Phone penetration is 24% among 18-34-year-olds
- 92% mobile vs. 8% desktop
- Phone penetration is 18% among 18-34-year-olds (2014 growth of 43%)
- 98% mobile vs. 2% desktop
- Phone penetration is 43% among 18-34-year-olds (2014 growth of 43%)
- 86% mobile vs. 14% desktop
Google+
- 86% mobile vs. 14% desktop
- Phone penetration is 18% among 18-34-year-olds (2014 growth of 28%)
Snapchat
- 100% mobile vs. 0% desktop
- Phone penetration is 33% among 18-34-year-olds (2014 growth of 57%)
- Read Our Snapchat Feature
Platforms that buck the trend of mobile-over-desktop include only LinkedIn (26% vs. 74% – but the highest phone penetration of all platforms: 75%) and Tumblr (46% vs. 54%, close to a 50/50 split). You see the trend, right? Mobile is without a doubt the future of content access, with the numbers to back it. Take a look at the full infographic below, then see my challenge to you at the bottom of this post.

Your Challenge…
If you aren’t using Google Analytics already on your website, go ahead and add it to your site now. Check back in a week or so to see where your traffic is coming from: mobile or desktop? Are you surprised?
The rise of mobile isn’t just about social, of course, but is indicative of how users are now accessing the entire web. Have a question about optimizing your brand’s platform for mobile? Leave it in the comments below, and we’ll do our best to help you out.
Digital & Social Articles on Business 2 Community
(57)