The History of Infographics
— March 3, 2017
Infographics are insanely popular today, with the number of available images increasing by 1% every single day. But where did infographics come from and how did they get to be so popular?
Infographics, by definition, mean: Images that share information in visual ways. When you break it down like that, so many pieces in our history actually qualify as infographics. Let’s take a little trip back in time, shall we?
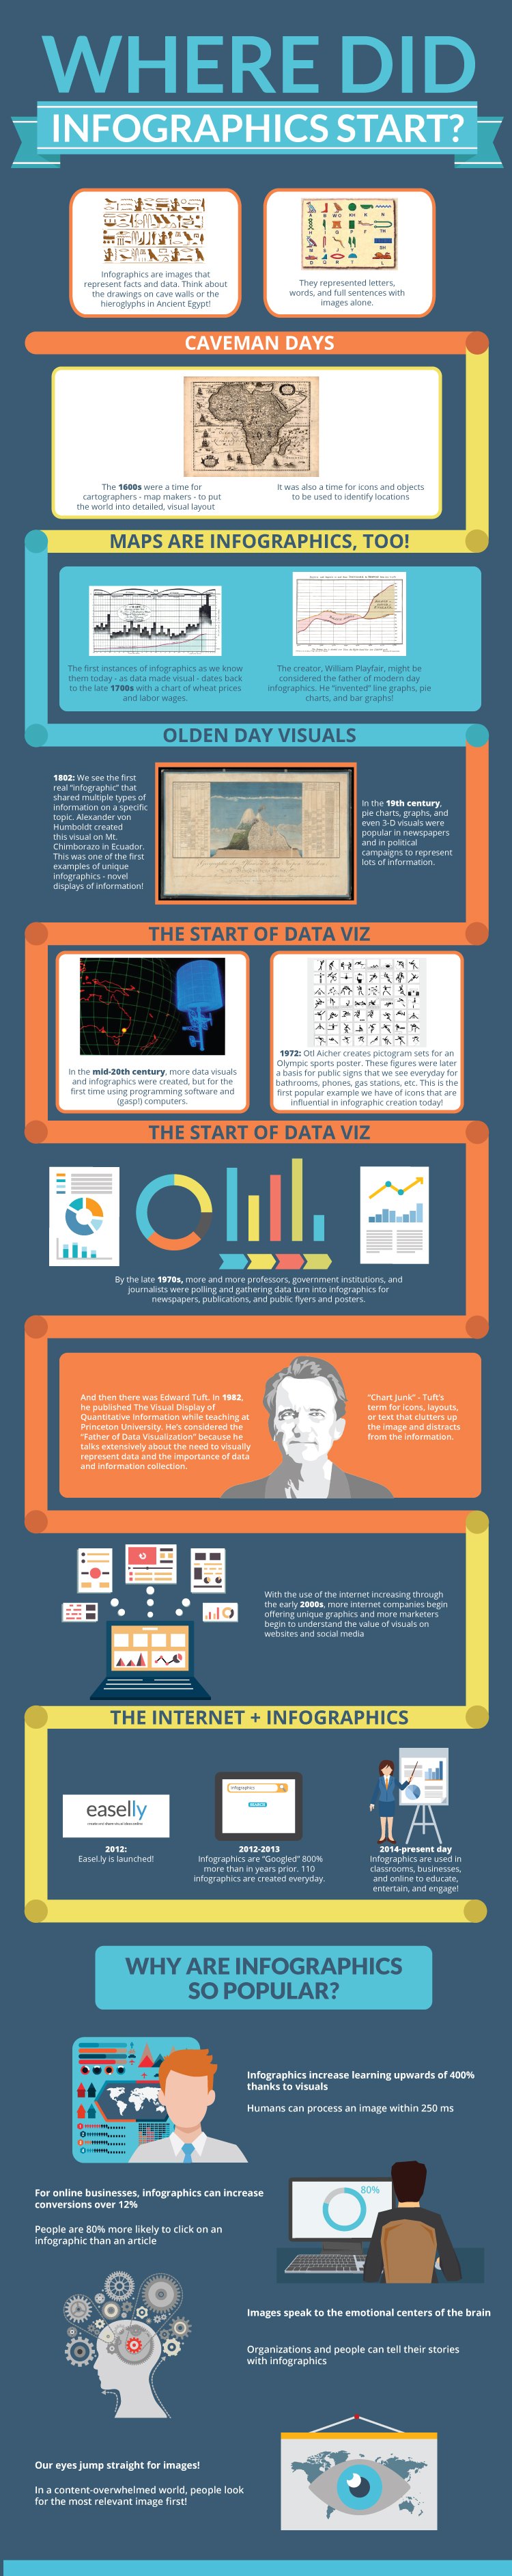
Where Did Infographics Start?
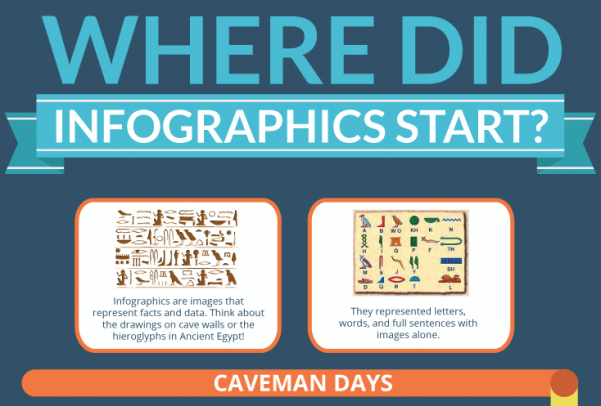
Caveman Days
Infographics are images that represent facts and data. Think about the drawings on cave walls or the hieroglyphs in Ancient Egypt!
- They represented letters, words, and full sentences with images alone.
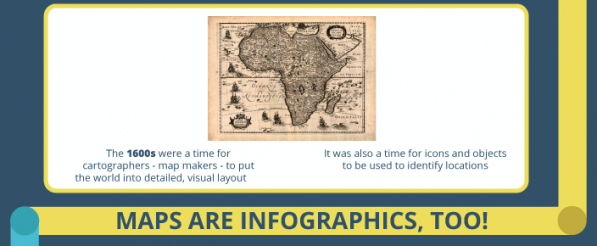
Maps are Infographics, Too!
- The 1600s were a time for cartographers – map makers – to put the world into detailed, visual layout.
- It was also a time for icons and objects to be used to identify locations.
Olden Day Visuals
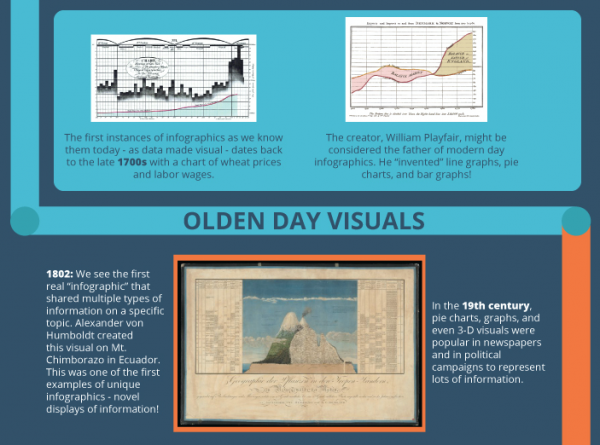
The first instances of infographics as we know them today – as data made visual – dates back to the late 1700s with a chart of wheat prices and labor wages.
- The creator, William Playfair, might be considered the father of modern day infographics. He “invented” line graphs, pie charts, and bar graphs!
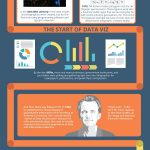
The Start of Data Viz
- 1802: We see the first real “infographic” that shared multiple types of information on a specific topic. Alexander von Humboldt created this visual on Mt. Chimborazo in Ecuador. This was one of the first examples of unique infographics – novel displays of information!
- In the 19th century, pie charts, graphs, and even 3-D visuals were popular in newspapers and in political campaigns to represent lots of information.
- In the mid-20th century, more data visuals and infographics were created, but for the first time using programming software and (gasp!) computers.
- 1972: Otl Aicher creates pictogram sets for an Olympic sports poster. These figures were later a basis for public signs that we see every day for bathrooms, phones, gas stations, etc. This is the first popular example we have of icons that are influential in infographic creation today!
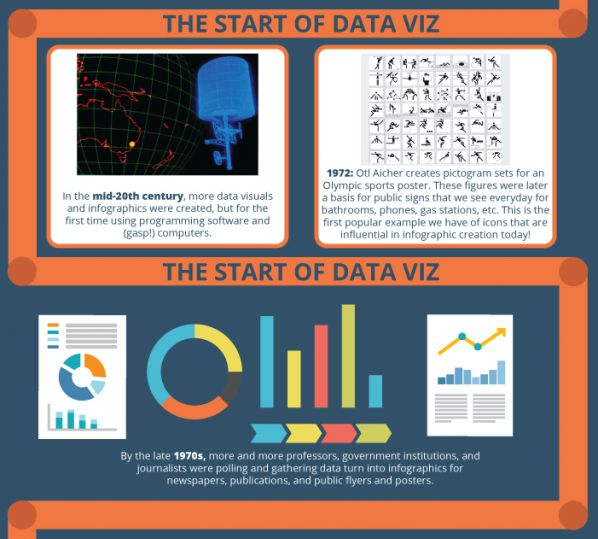
- By the last 1970s, more and more professors, government institutions, and journalists were polling and gathering data turn into infographics for newspapers, publications, and public flyers and posters.
Edward Tuft
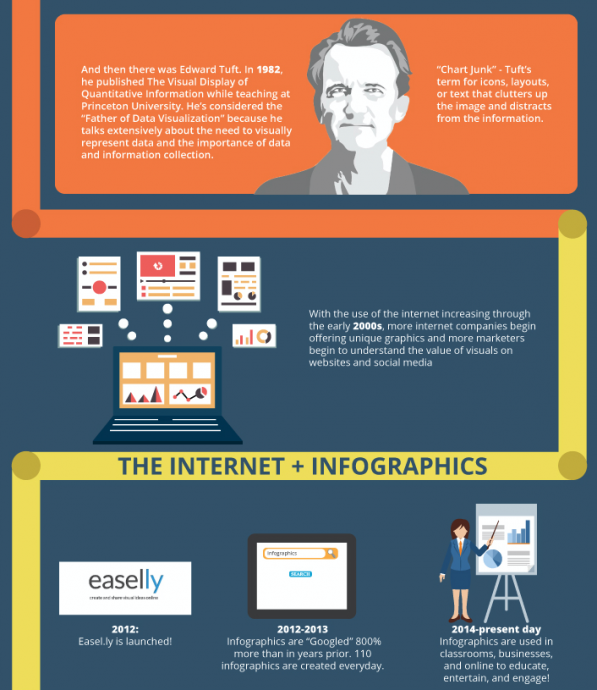
And then there was Edward Tuft.
- In 1982, he published The Visual Display of Quantitative Information while teaching at Princeton University. He’s considered the “Father of Data Visualization” because he talks extensively about the need to visually represent data and the importance of data and information collection.
- “Chart Junk” – Tuft’s term for icons, layouts, or text that clutters up the image and distracts from the information.
The Internet + Infographics
With the use of the internet increasing through the early 2000s, more internet companies begin offering unique graphics and more marketers begin to understand the value of visuals on websites and social media
- 2012: Easel.ly is launched!
- 2012-2013 Infographics are “Googled” 800% more than in years prior. 110 infographics are created every day.
- 2014-present day Infographics are used in classrooms, businesses, and online to educate, entertain, and engage!
Why are infographics so popular?
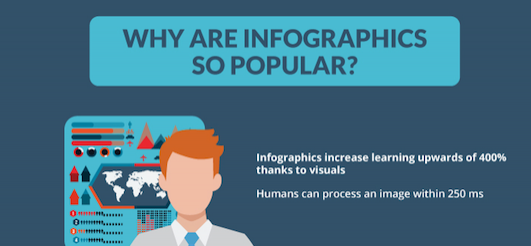
- Infographics increase learning upwards of 400% thanks to visuals
- Humans can process an image within 250 ms
- For online businesses, infographics can increase conversions over 12%
- People are 80% more likely to click on an infographic than an article
- Images speak to the emotional centers of the brain
- Organizations and people can tell their stories with infographics
- Our eyes jump straight for images!
- In a content-overwhelmed world, people look for the most relevant image first!
Share this Image On Your Site
Digital & Social Articles on Business 2 Community
(33)