
This Map Shows Commuters How Many Pedestrians And Cyclists Died On Their Route
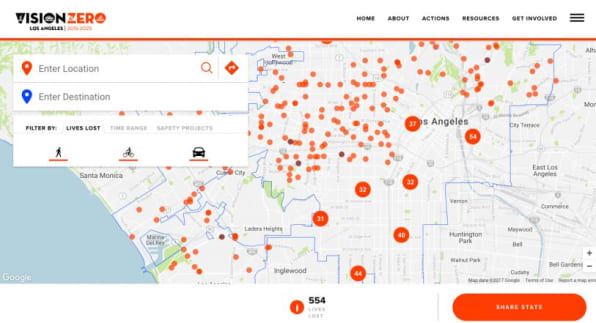
If you live in Los Angeles and plot your daily commute on a new map, it shows you how many pedestrians and cyclists (and drivers, for that matter) have died in traffic deaths along the way.
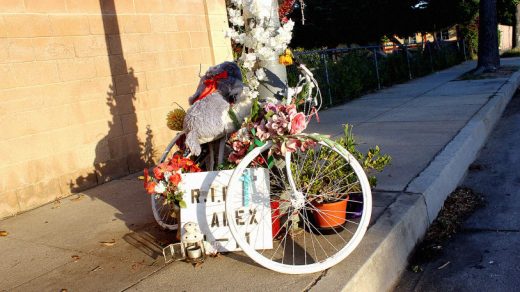
Each death on the map is marked with the victim’s age, and, in cases where the family consents, a memorial with more information. A 17-year-old wanted to be a film director and support his parents before he was killed crossing the street on his way to school in Highland Park in late 2015. A 72-year-old woman in North Hollywood was killed when crossing the street in a wheelchair. The city estimates that an Angeleno is killed in traffic roughly every 40 hours.
The data visualization “humanizes the problem and brings it to life,” says Levi Brooks, CEO and founder of Use All Five, a Los Angeles-based design studio that worked with the city to create the map.
By 2025, the city aims to eliminate traffic deaths. Planners are using data to identify the most dangerous routes–65% of serious injuries and deaths happen on just 6% of streets–and prioritize new safety projects such as bike lanes. Those safety projects are highlighted on the map, though the main purpose of the map is to help change behavior.
When the city studied the problem of traffic deaths, it found that male drivers between the ages of 18 and 54 were responsible for a disproportionate number of crashes–but their younger siblings or children were able to influence them to drive more safely. Armed with that knowledge, the designers worked closely with teenagers as they created the visualization. One of the teenagers suggested showing a daily commute.
The visualization is part of the city’s Vision Zero initiative, modeled on similar projects in other cities. The city is also running a series of traffic safety education campaigns. Next to MacArthur Park, in a neighborhood that is particularly dangerous for cyclists and pedestrians, volunteers will host a mapping and model-building workshop to help plan safety interventions and will host Peatonito, a pedestrian safety masked superhero from Mexico City.
For pedestrians and cyclists, the map could be used (at least temporarily, as safety improves) to consider an alternate route. “When you personalize the data, it possibly changes your opinion about whether this should be the right route, especially if you’re riding your bike a lot,” says Brooks, who bikes to work. “Or, if you’re a driver, maybe it makes you more cognizant of ‘Hey, that intersection has had a few problems, maybe I should slow down.’ Hopefully, that’s the biggest output–to change some behavior.”
(50)

