In November 2014, the Russian invasion of the Ukrainian peninsula, Crimea, became a virtual battlefield on Google maps. Initially Google Maps displayed Crimea as a disputed area with a dotted border. After pressure from the Russian government, Google was forced to changed it, so people in Russia now see it as Russian territory on Google Maps. Outside Russia it is still marked as a disputed area.
The notion that maps provide an objective or scientific depiction of the world is a common myth. The graphic nature of maps simplifies reality, giving makers and users a sense of power without social and ecological responsibilities. Details like the coloring of areas or the different sizes in typography can have great political consequences. For example, when names of towns are omitted from a map, it can imply that the area is not of interest, while adding names, details, and other information suggests it is an area of importance.
Mapmaking is a very old trade, but modern cartography originated in the age of European colonialism. Maps were indispensable for ships to navigate the oceans, and they legitimized the conquest of territories. Sometimes just mapping a newly found territory was enough to conquer it, without having to step ashore or have any knowledge of the indigenous population and history.
Even the fact that we put north on the top of the map is a result of the economic dominance of Western Europe after 1500. A map does not have a privileged direction in space. After all, the Earth has no up or down, and no geographical center.
The best way to depict the world is by showing a globe, but since a sphere can never show the entire world, translations to a flat surface are needed. The ways a sphere can be translated to a flat surface is called a projection. There is no such thing as the best or most accurate projection, since no curved surface can be projected without distortion. But some maps are better than others. Here are some of the most prominent examples:
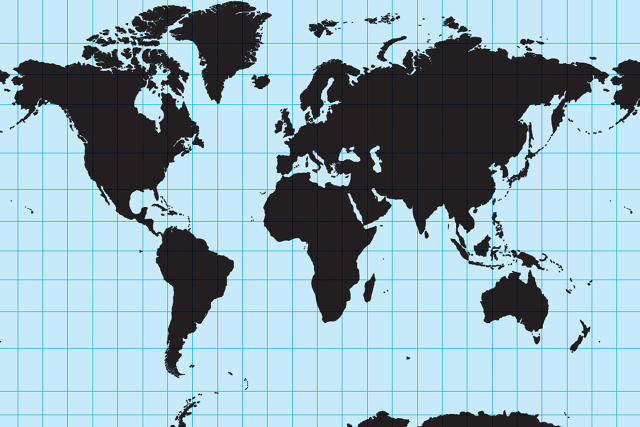
The Worst Choice
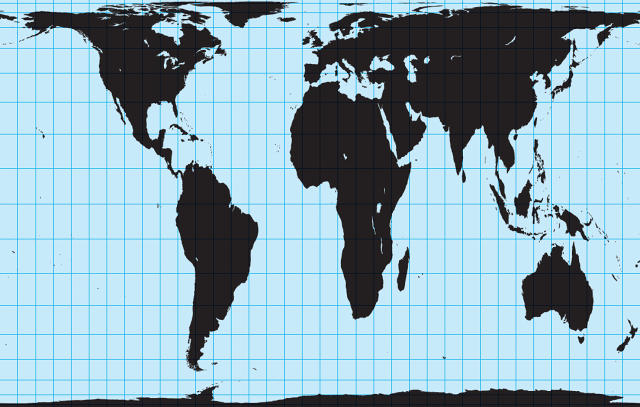
The Mercator map is the monstrosity that just won’t go away. It was probably used in your geography class, and it is the standard projection for Google, Bing, and Apple maps. The Mercator map was drawn in 1569 by the cartographer Gerardus Mercator for nautical purposes, using compass directions as straight lines. This stretches the northern and southern poles upward, making Africa and South America appear too small. Australia looks smaller than Greenland but is actually more than three times as large. The Mercator map gives us a 16th-century world view because it shows Europe larger, and the colonized countries smaller. Arno Peters criticized it in 1973 by saying, “It overvalues the white man and distorts the picture of the world to the advantage of the colonial masters of the time.” You should not use the Mercator map unless you have no other choice.
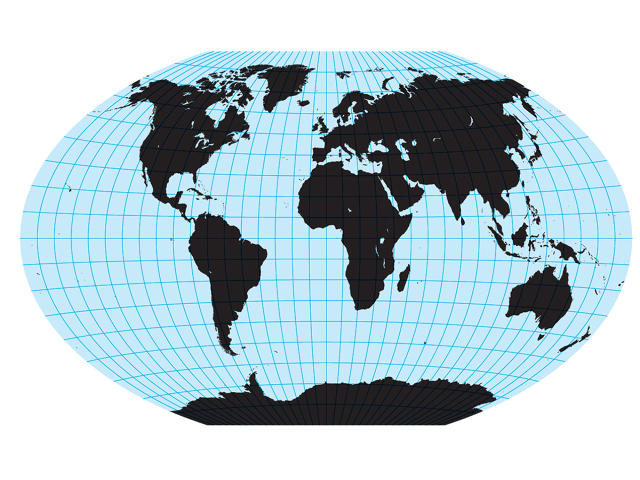
The Safest Choice
A world map is a projection of a three-dimensional space on a flat plane. These distort the distance, direction, or area size, and mapmakers have to choose which they find the most important. Some maps are better for compass direction, and some show a more accurate area size. The Winkel Tripel is a world map created in 1921 by the German cartographer Oswald Winkel, who tried to minimize the distortion of all three properties, hence the name Winkel Tripel (or Winkel III). It was fairly obscure until 1998, when the National Geographic Society announced that the Winkel Tripel was to be the preferred projection. Since then many schoolbooks and educational institutes have followed suit. The Winkel Tripel still has some distortion on the north and south poles, but it does a better job than many others. For an accurate depiction of the world, the Winkel Tripel projection is a safe choice.
The Most Politically Correct Map
When the German filmmaker Arno Peters criticized the Mercator map in 1973 for being colonial, he also presented an alternative. His solution was an equal representation of areas, so it could be used to compare the size of continents and countries. It turned out James Gall had done the same in 1855, and the map became known as the Gall-Peters map. Each area on the map represents an equal area of land. It might look strange to those who are used to the Mercator map, where Africa and South America are always depicted too small. The Gall-Peters map is considered one of the best world maps. It is promoted by the United Nations as a standard, and it is used in British schools. Its only flaw is that it distorts the shape of continents to make the areas equal. The arctic appears too flat, and the equator too tall. If you want a map that represents equal area size, this map is the politically correct choice.
The Best Designed (If Still Flawed) Map
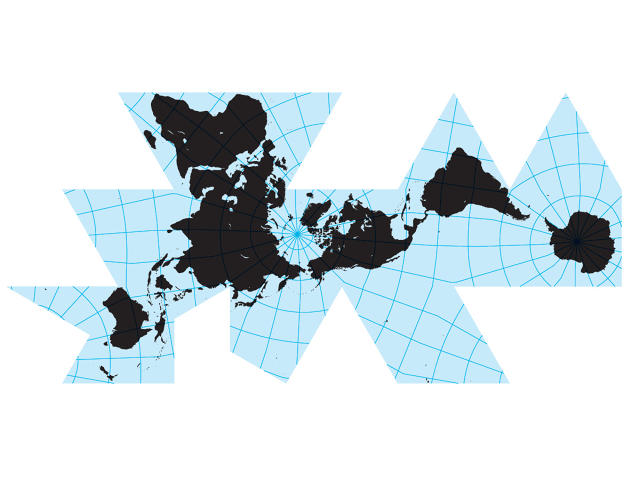
Why do world maps always face north? Why do they need a certain continent in the center? These are choices that are subject to cultural bias, and they are an unfortunate consequence of the mapmaking profession. That is why in 1943 the designer and inventor Buckminster Fuller designed a world map without top or bottom, left or right: the Dymaxion map. By dividing the map into 20 triangles, it could be folded into a sphere-like icosahedron. This way the map could be viewed in a way preferable to the user, not just the way the mapmaker envisioned. Its only flaw is that Fuller was not a cartographer. By using a different longitude and latitude on each triangle the directions are seriously flawed, and areas over multiple triangles are distorted. The Dymaxion map might not be very useful for serious cartography, but it does show all continents interconnected and offers a vision for a post-nationalist world. The “one island earth,” as Fuller called it.
This article was adapted with permission from The Politics of Design: A (Not So) Global Manual for Visual Communication (BIS Publishers). Buy a copy here.
Fast Company , Read Full Story
(155)
