
Report: Facebook owns the top mobile app in 10 out of 13 countries measured
Report from comScore examines key trends, shows mobile dominates user engagement but desktop still has greater reach in some markets.

Last week, comScore released its 2018 Global Digital Future in Focus report. The document looks at digital media usage patterns on desktop, smartphone and tablet in 13 international markets, including the US, the UK, Canada, India, Brazil, Western Europe and several other countries.
Digital media growth is still being driven by mobile, and mobile-only consumption is growing in most markets. But multiplatform usage is the norm in the US and appears to have stabilized. In the US, desktop time spent is just under 30 percent of all digital media time; however, the desktop audience is still larger than the mobile audience in terms of absolute reach.
Average minutes per user by platform

Desktop vs. mobile unique users

Among mobile users, apps remain the dominant focus, at just under 90 percent of mobile minutes in the US. That’s roughly comparable to other markets, where app time hovers above or just below 90 percent. Canada has the lowest percentage (85 percent) and Argentina the highest (95 percent) of time spent with apps.
Share of total mobile time: Browser vs. app

The top five apps list in each country is fairly consistent, though Facebook does not appear in all markets. However, Facebook-owned WhatsApp is the top app is seven of 13 countries. Overall, then, Facebook has the number one app in 10 out of 13 countries in the report.
Snapchat has broken into the top five in the US and UK markets. And Google has at least two or, in many markets, three of the top five apps.
Top 5 apps by country

The majority of time spent with apps is highly concentrated in four categories: entertainment (including video), social, messaging and games. These four categories combine to capture roughly two-thirds of overall app time globally.
Category share of app minutes

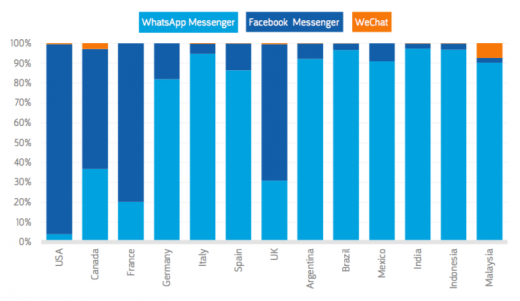
The following graphic shows the market share of the major messaging apps across the measured countries. Outside the US, Canada, the UK and France, Facebook Messenger has a relatively small share vs. WhatsApp. This chart alone illustrates why Facebook bought the company in 2014 for more than $16 billion in cash and stock.
Combined minutes for major instant messaging apps

There are nuances that I haven’t fully captured in my post above. However, the story the report tells is one of heavy concentration of user time in mobile and in turn, in a small number of apps at the top of the pyramid.
Most of the macro trends are fairly consistent. However, developing markets (e.g., India) that are coming online primarily through mobile devices have a less developed PC infrastructure and are heavily skewed toward mobile only.
About The Author

Greg Sterling is a Contributing Editor at Search Engine Land. He writes a personal blog, Screenwerk, about connecting the dots between digital media and real-world consumer behavior. He is also VP of Strategy and Insights for the Local Search Association. Follow him on Twitter or find him at Google+.
Marketing Land – Internet Marketing News, Strategies & Tips
(36)
