The number of new businesses opened is important to the economy. But that number doesn’t effectively measure impact. That’s why the Kauffman Foundation is building on its annual Index with an in-depth study of Growth Entrepreneurship.
The Growth Entrepreneurship Index measures both business revenue and job growth using data from the U.S. Census Bureau’s Business Dynamics Statistics on all new employer firms, regardless of industry. The measurement is based on three indicators:
- Rate of Startup Growth —which looks at the average growth trajectory by measuring employment at new firms from launch through their fifth year
- Share of Scaleups—this captures the number of business starting small and becoming medium-sized or bigger (with more than fifty employees)
- High-Growth Company Density—looks at annualized revenue growth of 20% over a three-year period at any stage of the business.
Kauffman’s researchers reasoned that while the number of patents a business applies for, as well as the venture capital it raises, and the corresponding valuations (especially around billion dollar “unicorns”) all signify growth, there’s a more direct contribution to the economy from revenue and job creation.
The report’s authors write:
“We know that around 45% of new businesses survive their first five years of operation, with the rest of the new businesses ceasing operations or being absorbed into other businesses. Others have described this as a process of experimentation, as entrepreneurs seek to find their markets and certain businesses continue operating and expanding.”
Which makes this year’s findings especially promising. Although not as strong as it was in the ’80s and ’90s, entrepreneurial growth continued for the third straight year. What’s more, the largest growth in a decade posted this year, a sign that the slump of the recession is now well past.
Kauffman’s analysts found this year’s growth is driven primarily by startups that are growing faster in their first five years than they were before. The size of companies also played a part; more companies are reaching the scale of medium-sized or larger—meaning they employ 50 or more people.
Drilling down further into the detailed findings reveals:
The Rate of Startup Growth was 58.5%, representing a jump of 11.6 percentage points. That means newer companies contributed approximately 200,000 more jobs to the economy than in the previous year.
The Share of Scaleups rose to 1.1%. This means that approximately 1,100 companies out of every 100,000 firms 10 years and younger started small and reached a scale of more than 50 employees. While this is an increase from the previous years, the Share of Scaleups is still below the historical range seen through most of the 1990s and the first part of the 2000s before the tech bubble burst.
High-Growth Company Density remained flat in the recent year at 79.3 high-growth companies for every 100,000 U.S. employer businesses. The plateau is still an increase from where it was during the recession.
Where exactly are these high-growth new businesses?
Unsurprisingly, the industries with the highest share of rapidly growing new firms follow overall economic trends. For example, in the days before the economy fell into recession, construction was king. The industry held the second-highest number of fast-growing businesses. However, when the housing bubble burst, the sector went into free fall, plummeting 71.2% between 2007 to 2010, down from 479 to 138 high-growth businesses in each year.
While the recession was still gripping the country, Government Services held steady as the number of high-growth companies rose from 167%, from 102 companies in 2007 to 272 companies in 2010. Growth turned to shrinkage after the peak of the recession.
The picture looks pretty different now.
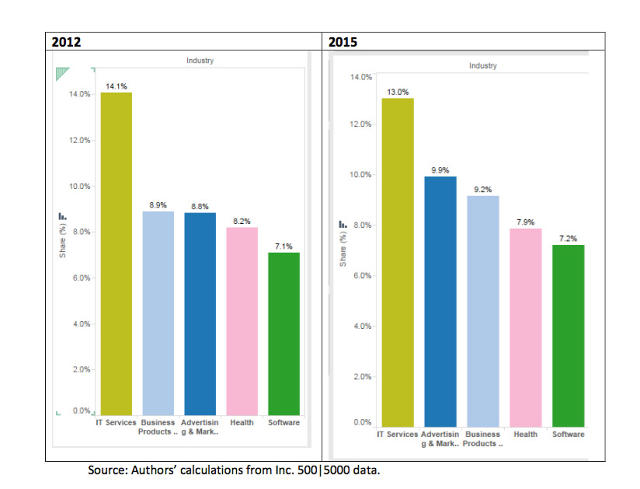
Beginning in 2012, the top five industries have remained the same, they are:
- IT Services
- Advertising and Marketing
- Business Products and Services
- Health
- Software
These industries have hung on to the top spots each year since. Kauffman’s analysts report that among the top five sectors, IT Services, Advertising and Marketing, Business Products and Services, and Software have each performed well every year, despite the ups and downs of business cycles. Health, on the other hand, is the only industry here that has consistently experienced increases almost every year—even during the recession.
No wonder both technology and health care were recently ranked as the top two industries for job opportunities by SmartRecruiters. And as the Kauffman analysts predicted, this impacts the economy. Not only are there more jobs created, but these jobs are among the highest paying in 2016. That translates to more income that can potentially be spent on goods and services.
Fast Company , Read Full Story
(38)
