This Map Shows Which Parts Of The U.S. Will Suffer Most From Climate Change
If you live in Texas or Louisiana, your community will be harder hit by climate change than cities in New Hampshire or Oregon. By the end of the century, if emissions continue unchecked, some parts of the U.S. will see far greater economic damage from climate than others–and because the communities that will be affected most tend to be poorer, the shift will also widen income inequality.
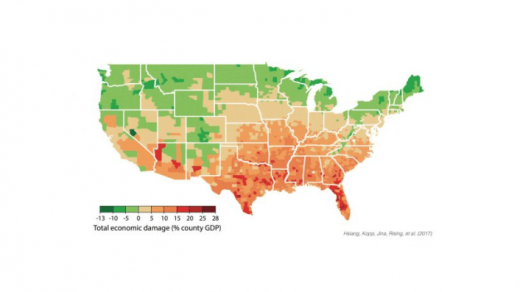
A new map shows the projected county-by-county damages for the last two decades of the century, with the counties facing the heaviest burden shown in dark red. Those in green are likely to see some economic benefit, though as temperatures continue to warm, those benefits may be temporary. The impacts are highest in the South, where temperatures are already hotter.

“One of the overarching patterns that we’ve seen in real world data, over and over again, is that when you’re hot, getting hotter is much more damaging than if you start out pretty cool,” says Solomon Hsiang, an associate professor of public policy at the University of California-Berkeley and one of the authors of a new study that used state-of-the-art statistical methods and more than 100 climate projections to calculate the local costs of climate change.
In Phoenix, for example, where temperatures regularly reach well over 100 degrees already, an increase in average temperatures would mean an increase in deaths. Agriculture in the area would struggle with the heat and lack of rain. Workers would get less work done, especially outdoors. Energy bills would go up. In a cooler location, such as Seattle, climate change might have the opposite effect: an increase in temperatures could actually reduce mortality rates and energy costs.
“You get this pattern where the north benefits and the south is really harmed because it’s already so hot,” he says. “But it also happens to be the case that the south tends to be poorer today, due to a variety of historical circumstances, and the north tends to be richer. If the south tends to be damaged more, and they tend to be poorer, you end up widening inequality.”

Cooler states also face challenges. Property crime increases as the number of cold days decreases; violent crime also increases with heat. States along the East Coast, whether in the north or south, face more risk from coastal flooding and storms as sea levels rise and hurricanes become more intense. And despite regional differences, the whole U.S. economy will suffer; the researchers estimate that for every degree Fahrenheit of warming, GDP will drop 0.7%. But on balance, the impacts in warmer states will be more significant. The poorest counties could face damages that cost as much as 20% of their income.
The level of detail in the analysis, which took four years, goes beyond anything ever achieved in the past; prior studies often used rough estimates or limited models that looked at the continental scale, not individual counties. The researchers pulled 116 other studies into their model, using a system designed to be updated as more studies become available (the damages will be more significant than it is possible to estimate now–it isn’t yet possible to easily assign a cost to the loss of biodiversity that will also come from climate change, for example).
Advances in computing also made it possible for the researchers to run 29,000 simulations of the national economy. “This took a huge amount of cloud computing time and power… That’s the kind of thing that would have been impossible 10 years ago, and unimaginable 20 years ago,” Hsiang says. “Now that we know how to do these types of things, there’s no reason why we shouldn’t be doing them in real time. Not just for climate change, but for everything–for deforestation, for global fisheries- we should be leveraging these tools in ways that we haven’t applied them in the past.”
The new analysis could be used in two key ways: First, to help people better understand the consequences of decisions made on climate policy now, and second, to begin to better prepare for local impacts. In a 2016 survey from the Yale Program on Climate Change Communication, most Americans agreed that global warming was happening, but few thought it would harm them personally. Opinions on whether it would ever harm people in the U.S. were mixed, particularly in some of the counties that will be most affected. (It’s worth noting that climate change has already been linked to impacts in the U.S., and though the map shown here focuses on the end of the century, more damage will occur earlier).

While 62% of North American cities have started to prepare or plan for how to adapt to climate change–from plans for a massive flood protection zone in New York City to higher seawalls and a new pumping system in Miami, where flooding is already a problem–each city has more work to do. Some haven’t started. The analysis could help communities plan for local effects.
“It’s not like the response should be uniform across the country,” says Hsiang. “We want to tailor it to what we expect to matter most in different parts of the country. This type of analysis lets us see where we should focus.”
Now, the researchers are working on a version for the rest of the world. “This project started four years ago, and partway through, we realized this is working,” he says. “We’re going to achieve many of the things we wanted to achieve. So we’ve taken the methods and innovations here and are scaling them up to the entire planet.”
If you’re near the ocean, or if it’s already hot where you live, time to start preparing.
If you live in Texas or Louisiana, your community will be harder hit by climate change than cities in New Hampshire or Oregon. By the end of the century, if emissions continue unchecked, some parts of the U.S. will see far greater economic damage from climate than others–and because the communities that will be affected most tend to be poorer, the shift will also widen income inequality.

A new map shows the projected county-by-county damages for the last two decades of the century, with the counties facing the heaviest burden shown in dark red. [Image: Hsiang, Kopp, Jina, Rising, et al. (2017)]

Those in green are likely to see some economic benefit, though as temperatures continue to warm, those benefits may be temporary. The impacts are highest in the South, where temperatures are already hotter. [Image: Hsiang, Kopp, Jina, Rising, et al. (2017)]

There are also maps for individual cities, like New York.[Image: Hsiang, Kopp, Jina, Rising, et al. (2017)]

Houston. [Image: Hsiang, Kopp, Jina, Rising, et al. (2017)]

Miami [Image: Hsiang, Kopp, Jina, Rising, et al. (2017)]

Norfolk, Virginia. [Image: Hsiang, Kopp, Jina, Rising, et al. (2017)]

Washington, D.C. [Image: Hsiang, Kopp, Jina, Rising, et al. (2017)]
Fast Company , Read Full Story
(40)