Which U.S. cities’ transportation networks are doing the best for the climate?
Transportation is the leading source of carbon emissions in the United States, with cars, trucks, planes, trains, and boats emitting 1.9 billion tons of CO2 each year. Cities are facing intense pressure to be more environmentally friendly, but what really makes a city “green” when it comes to transportation? According to a new ranking on the climate impact of transportation in the country’s 100 largest metro areas, it may not be entirely contingent on having a lot of bike lanes or good public transit.
Mobile analytics company Streetlight Data released this week its first annual U.S. Transportation Climate Impact Index, a ranking of how carbon friendly the country’s 100 largest metro areas are on several factors: total vehicle miles traveled (VMT), how much people are biking and walking, transit usage, population density, and circuity, which is basically the difference between how far two destinations may be as the crow flies and the route it actually takes to travel that distance by car. “If you have a messy urban road design, you might have people who, because they’d rather get on the highway than drive through town, drive way more miles then they need to to get from one place to another,” says Streetlight Data CEO Laura Schewel. “And that’s another place where you have a lot of potential for improvement.”
Though transit and bike infrastructure are included, they’re not the most important factors in this ranking. The most heavily weighted one was those vehicle miles traveled in a car. “We made it so that [an area] could have no transit and do well, because transit usage is not what drives carbon emissions, driving is what drives carbon emissions,” Schewel says. “So if you manage to have a city where people on average are driving a lot fewer miles per capita to get what they need done, that’s just as good as having a city where a small portion of the people are taking transit.”

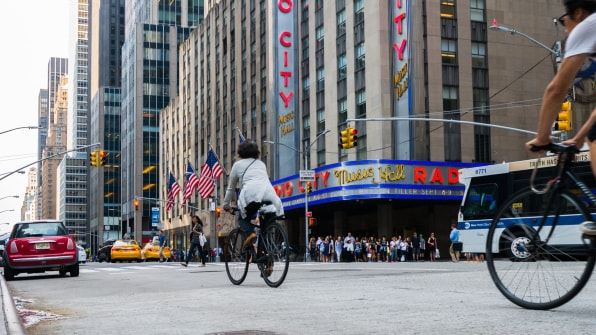
The New York-Newark-Jersey City metro area earned the number one spot, thanks in part to its high biking, pedestrian, and transit commuting. Still, that metro area also had a high VMT score, most likely from those outside of the five boroughs who drive in and out of the city a lot. New York policy makers in particular have been criticized for seeming to still prioritize cars over other ways of getting around, but all the people who walk, bike, and take the subway helped balance out those miles driven on this ranking.
In the second spot was the San Francisco-Oakland-Hayward area, for a lot of the same reasons: high pedestrian and biking participation, despite often clogged highways and bridges. A few other of the top 10 metro areas may seem a bit surprising, though. Des Moines, Iowa—which has 19.4 parking spaces per household, and which didn’t earn any credit for transit because it isn’t ranked by the American Public Transit Association—came in at number seven, and Lancaster, Pennsylvania, which also has a minimal bus and shuttle system that also isn’t ranked by APTA, landed at number eight. Lancaster had the lowest VMT ranking, which Schewel contributed to the fact that people tend to drive short distances, and also because the Amish community there, which accounts for more than 3% of the population, use horse and buggies. The worst 10 metro areas in terms of carbon-friendly transportation tended to be big, sprawling cities—Dallas, Houston, Atlanta—which wasn’t surprising to Schewel. “The vehicle miles traveled per capita is just going to be high,” she says.
When we compare the U.S. to Europe, it’s clear our cities still have far to go to be more environmentally friendly and, related, have less traffic congestion, and Schewel admits this, too. “There’s lots of different countries in Europe, but in general, the amount of funds available to invest in sustainable transportation infrastructure is radically greater than in American cities. With that much money and those many resources, you have a lot more tools in your toolkit,” she says. “From a big picture policy perspective, we need to put more money in this, but a mayor or city planner today can’t wait for federal policy to change.”
This ranking, she adds, was a way to measure the kind of progress that is realistic for these U.S. cities, and also look at metro areas as a whole. One walkable downtown doesn’t mean an area is very sustainable, especially if housing is expensive and most people have to live far away. All sorts of factors are at work here. “For some cities, more bike lanes are the answer. For some cities, it’s about urban planning, so that you don’t have to drive 18 miles to get to the grocery store. And for a lot of cities, it’s thinking about their housing costs, so people can afford to live near their work,” she says. “There’s nothing bad about bike and pedestrian investment. To move a one-mile car trip to a pedestrian trip is good. But to cut a 10-mile car trip to five miles is five times as good.”
Schewel hopes this ranking can move the conversation away from certain cities that are always lauded as “green” for having a dense downtown, even though the metro area as a whole is very sprawled out. This is the first of what will be an annual ranking, and she expects to see changes as it grows, not just in how the metro areas rank with one another but in what they are ranked on, as well. “Soon electric vehicles, we hope, will be prevalent enough to matter, so we could look at EV ownership as a way to mitigate those VMTs,” she says. “Not only will the rankings change as cities make different investments, but as we continue to complexify and discuss the definition of ‘what is transportation sustainability,’ this will grow as well.”
(15)


