A Chart Worth Billions Of Words Explains This Week’s Internet Sell-Off
A Chart Worth Billions Of Words Explains This Week’s Internet Sell-Off

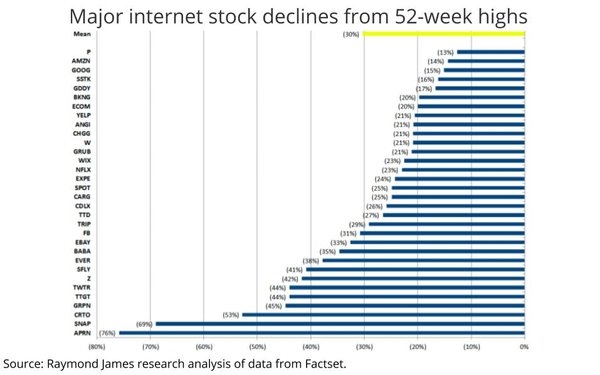
If a picture is worth a thousand words, this graphic illustrating the share price erosion of the major publicly traded internet stocks from Wednesday’s selloff is worth billions.
While the average decline was about 30%, blue chips like Amazon and Google held their own, although Facebook continues to erode faster than the overall sector.
1) Concerns over increasing yields with the 10 year treasury yield now at 3.2% (highest since 2011). “We believe the concern for Internet companies is increasing cost of capital, concerns if raising rates slows growth (e.g. housing slowdown) as well as sector rotation into areas that benefit from increasing rates (e.g. Financials).”
2) Continuing trade tensions particularly with China and neither side appears to be backing down.
3) Concerns around slowing emerging market economies including China and Brazil.
4) Risk-off trade for higher beta internet companies.
(12)


