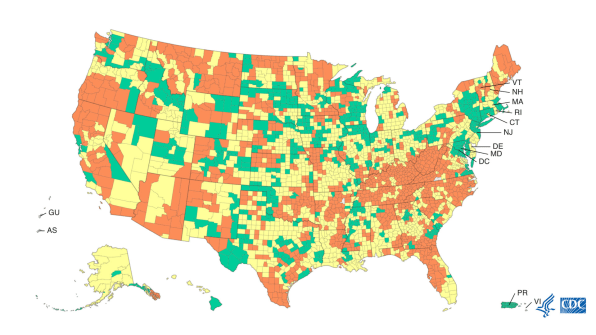
CDC COVID tracker: Updated map shows community level in your county
If you’re wondering what the community level of COVID-19 is in your area, the Centers for Disease Control and Prevention (CDC) has an updated map that makes the latest data easy to see. The U.S. COVID-19 Community Levels by County map covers all U.S. States and territories and breaks down the level of spread on a per-county basis.
Under the CDC’s newest framework—announced on Friday—the COVID-19 community level is determined by looking at the total number of COVID-19 cases in the area as well as hospital admissions and hospital bed occupancy. The CDC then uses that data to apply one of three different color-coded levels:

The interactive map lets you click on any state to see all its counties. You can then click on any county to see its COVID-19 community level. Additionally, the page has a dropdown menu that lets you select your state and county to quickly see your community level as well as a list of precautions you should take.
(22)

