— April 21, 2017

Have you ever wondered what percentage of your website visitors are returning, how long they stay on your website or what pages they look at while they are there? Google Analytics (GA) tracks a multitude of statistics like these, yet according to BuiltWith, only 7.8 percent of the 370 million websites on the Internet use Google Analytics. Given what Google Analytics can do, the percentage is shockingly low, but understandable too. Although GA has long provided a treasure trove of information about a website and its traffic, for business owners, it’s not been an intuitive interface to tackle. Now, there’s the incredibly user-friendly Google Data Studio.
Google Data Studio, still in beta, is a new tool that pulls data from your Google ecosystem, Google Analytics or AdWords as examples, into visual dashboards. We took a spin with Google Data Studio to see if we could put together a quick, informative, visual report pulling key information from website data in GA. It was a breeze.
Now you can create a remarkable, easy to understand snapshot of your website traffic using Google Data Studio. You’ll quickly see the value of the data as you grow your business and marketing efforts. You’ll need to connect Google Analytics to your website first, and then you’re ready to begin.
Step 1: Sign up for Google Data Studio
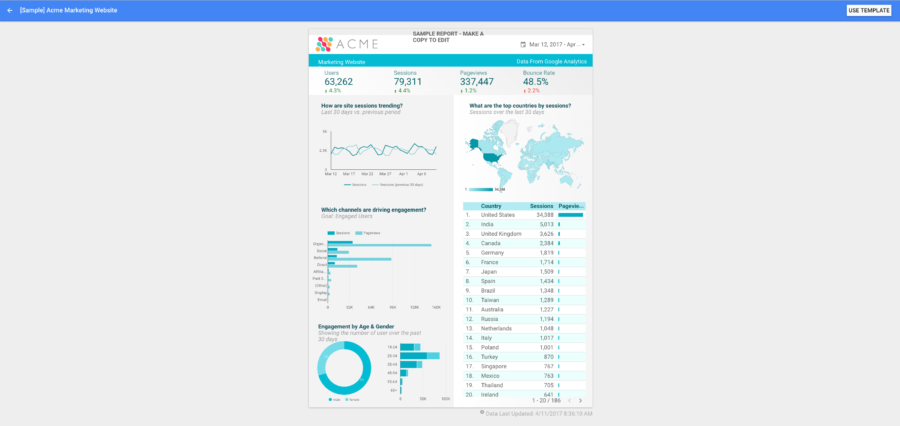
Go to Google Data Studio and signup for free using your Google account. Use the same Google account linked to your website Google Analytics because Google Data Studio does not replace GA, but rather provides more user-friendly dashboards for viewing the data. Once you login to Data Studio, you will see a dashboard, and there are several pre-built templates which are set up to help you visualize data from many different sources including Google Analytics. You can completely customize and create your own report, but we grabbed the Google Analytics template for Acme Marketing – [Sample] Acme Marketing Website – as a starting point.
Step 2. Select your data source for the Google Data Studio report
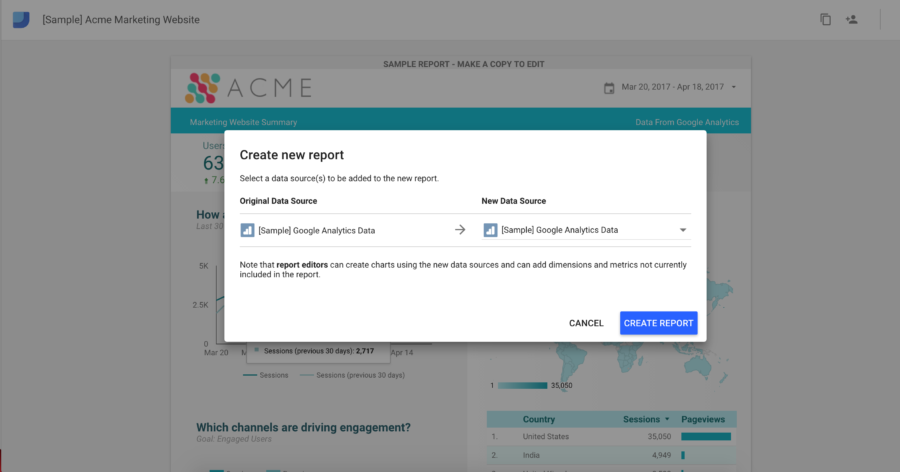
When you click on the Acme Marketing Google Analytics template, a turquoise and gray sample report pops up. In the top right of the screen, there is an icon which gives you the option to “Make a copy of this report.” Copy it and you will see a pop-up screen “Create new report.”
The Acme Marketing report uses sample data. To populate your report with your own website data, you will need to connect the Google Analytics data for your website.
In the pop-up window, look to the right where it says New Data Source, then:
- Click on [Sample] Google Analytics Data
- Click the blue CREATE NEW DATA SOURCE
- In the left sidebar menu entitled Connectors, choose Google Analytics
- Pick the relevant Account, (website) Property and View
- Click the CONNECT button in the top right-hand corner
- Click the ADD TO REPORT button in the top right-hand corner
- Under the New Data Source section, your website Property is now listed, so you can CREATE REPORT
You’re connected!
Only 7.8 percent of the 370 million websites on the Internet use Google Analytics. – BuiltWith
Step 3. Customize the Google Data Studio report layout, theme, and elements
- First things first – name your report in the top left of the screen near the Data Studio icon by typing over the words Copy of [Sample] Acme Marketing Website
- Pick your date range by clicking the calendar dates in the top right of the report and select date range in the right sidebar
- Click and delete sample elements such as the Acme Marketing logo on the top left and the note centered at the top, “SAMPLE REPORT – MAKE A COPY TO EDIT.”
- Add your own graphic or text elements. Here are two examples. Add a logo by clicking the image icon in the top menu (a square with a mountain) and drag out a square or rectangular space with your cursor. Click Select a file in the right sidebar under DATA and choose your logo from your computer files. The logo will be sized and put in the outlined space. To add text, click the text icon in the top menu (a box with a “T”), draw out a square or rectangle with the cursor and type in your text. Customize your Text Properties in the right sidebar.
If you want to add more data views, you can either delete and replace what is in the sample report, or:
- Add a blank page to the report with the “+Add a page” option on the top left of the menu.
- Add custom elements
Here’s another quick example:
- Choose the Table icon on the top menu
- Drag out a rectangular or square shape with your cursor
- Immediately the table is populated with default source data, so in the right sidebar menu, click the green Source button under Dimensions
- Choose whichever data dimension you want to see
- Need a shorter table? Drag the lower border up and fewer entries will show.
- Prefer a different visualization? Repeat these steps choosing a different option besides Table or change your data source.
You can continue to add pages or visual dashboards that are useful to you. All of the elements of the report can be stylized to match your brand colors by clicking on them and using the STYLE options in the right sidebar. Your report is automatically saved because you are in the Google cloud ecosystem. Plus, all of the features you are used to with Google Docs such as sharing and download as PDF are either available or coming soon.
The best part? Once you create the report you want, you can change the date range each month and refresh the report for an updated view.
We’re loving the new Google Data Studio as an intuitive, interactive interface to view essential Google Analytics data for a website. Give it a try and tell us your thoughts in the comments!
__________________
Originally published on the Resourceful Business blog on April 20, 2017.
Digital & Social Articles on Business 2 Community
(82)
