Mobile Commerce Accounts for More Than 31% of Total Sales [2017 Data]
— September 28, 2017
![Mobile Commerce Accounts for More Than 31% of Total Sales [2017 Data] | DeviceDaily.com Mobile Commerce Accounts for More Than 31% of Total Sales [2017 Data] | DeviceDaily.com](https://www.devicedaily.com/wp-content/uploads/2017/10/01-Mobile-Commerce-Accounts-for-More-Than-31-of-Total-Sales-2017-Data.png)
Earlier in 2017, Brandon Chatham from NatoMounts told me he was seeing 80% of his site traffic coming in from mobile. Then, he said he was converting more than 5% of them.
With industry average conversion rates on desktop sitting at 2% –– that’s not just a good mobile conversion rate.
It’s a mobile conversion rate nearly unheard of.
My next question was easy –– it was falling out of my mouth as I was gawking:
“How did you get mobile conversion so high?”
Well, Brandon did a few things:
- He used digital wallets intelligently, allowing customers to use one-click payment options like Apple Pay, Amazon Pay and PayPal One-Touch on mobile devices
- He designed his site to be only a single page –– making him homepage, product page and landing page all the same thing (not feasible for every brand, clearly, but works for him!)
- Use Facebook advertising to drive mobile traffic and use psychological tactics like scarcity and FOMO to drive sales.
The revenue just rolled in.
It also got the teams over here thinking:
“What other brands are seeing mobile commerce success like this?”
So, we went to work with our data team to uncover 2017 Mobile Commerce data across the BigCommerce platform.
And what we found is this:
Consumer expectations worldwide have forced ecommerce sites to adapt to mobile needs –– and the ones that do make more money, more quickly than ever before.
It turns out, Brandon isn’t alone. More and more brands are seeing mobile traffic continue to increase (as it has for years). But mobile conversion –- that once elusive beast –– is going up, too. For some brands, really, really quickly.
Here’s what we know.
Make Mobile Count
Get your free guide to designing mobile experience that convert right here.
Make Mobile Count
Get your free guide to designing mobile experience that convert right here.
What’s Changed in Mobile Commerce [The Numbers]
Shifts in mobile commerce convenience
- Increased trust: more consumers feel comfortable shopping on mobile.
- Faster checkouts: one-page checkouts and digital wallets (Amazon Pay, Apple Pay, PayPal One Touch) improve mobile conversion by up to 10% at launch.
- Easier to use sites: More and more sites are now optimized for mobile use.
Revenue impact for the retail industry
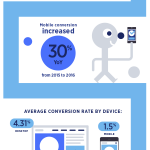
- Mobile conversion increased 30% YoY from 2015 to 2016
- In 2012, mobile sales accounted for 10% of total purchases across BC stores
- In 2016, mobile sales accounted for 31% of total purchases
Same store mobile commerce growth by country YoY
- U.S. businesses – 24% growth
- Australia & New Zealand businesses – 33% growth
- European businesses – 18%
- Canadian businesses – 19%
- Asia-based businesses – 42%
- Other – 30%
Device differences
- iOS users spend 18% more on average than Android users.
- Desktop AOV is 53% higher than mobile AOV (iOS + Android)
Desktop still matters
- Desktop AOV is 50+% higher than mobile AOV
- Average conversion rate by device:
- Desktop: 4.31%
- Mobile: 1.5%
Digital wallets change the mobile commerce game
“When we designed our new website, I told the designer, ‘Don’t send me desktop designs. Make mobile perfect, then make a responsive version for desktop,’” Brandon Chatham, CEO, NatoMounts.
“We’ve achieved 5% conversion rates on mobile with over 80% of our sales on mobile devices.
Digital & Social Articles on Business 2 Community
(16)

![Mobile Commerce Accounts for More Than 31% of Total Sales [2017 Data]](https://www.devicedaily.com/wp-content/uploads/2017/10/02-Mobile-Commerce-Accounts-for-More-Than-31-of-Total-Sales-2017-Data-386x2080.png)
![Mobile Commerce Accounts for More Than 31% of Total Sales [2017 Data] | DeviceDaily.com Mobile Commerce Accounts for More Than 31% of Total Sales [2017 Data] | DeviceDaily.com](https://www.devicedaily.com/wp-content/uploads/2017/10/02-Mobile-Commerce-Accounts-for-More-Than-31-of-Total-Sales-2017-Data.png)


