New Study Reveals That Video is King in Instagram Stories
— August 1, 2019
Instagram Stories have been introduced almost three years ago, in August of 2016.
Since then, it has become such a success, that accordingly to Techcrunch, over 500M accounts on Instagram have used Stories by the time of January 2019.
The users who use Stories are increasing at an astonishing rate, and it offers a great opportunity for people to utilize this feature for their own benefit.
A brand new study by Socialinsider shows the results of extensive research on Instagram Stories, which will give you in-depth insight on how to use this feature to its fullest potential.
As a result, you will gain knowledge of scientifically proven methods on creating the best possible content, which will draw the attention of many Instagram users.
In order to draw truthful and strong conclusions, this research on Stories examined almost 136,000 Stories which were posted by 2,548 different Instagram business accounts to engage their audience, build brand popularity, and increase sales.
Here are the main insights you can use yourself in order to improve your Instagram engagement.
#1. 51% of brands are using video in Stories
51% of all analyzed business accounts on Instagram are using videos in addition to photos in their Stories. The reason is simple. Videos create a bigger impact on the viewer than a mere photo.
In addition, one technical advantage of videos over pictures in Stories is that the former can be up to 15-seconds long, while pictures can only be seen for up to 7 seconds at the time.
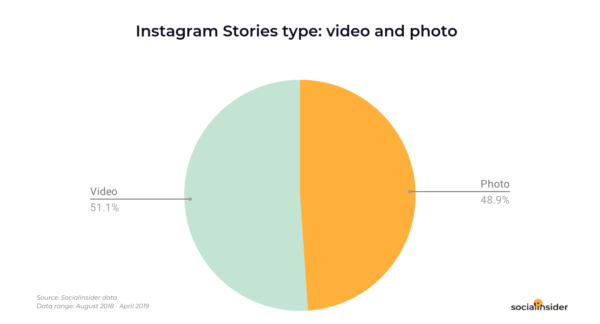
- Type of Stories on Instagram
#2. Brands posts Stories every four days
The research indicates that every brand of any size audience posts seven days per month. It equates to a post in Stories every four days.
Digging deeper, we can find some difference between Instagram pages with different sized audiences.
Brands with Instagram pages with other 100,000 followers publish a Story every two days, which is twice as much compared to pages with the following of at least 10,000.
This difference might be explained by understanding that brands with bigger following are more popular, thus they can invest more in quality content for their Stories. Brands with a lesser following cannot allocate as many resources as their bigger counterparts, thus they post more rarely.
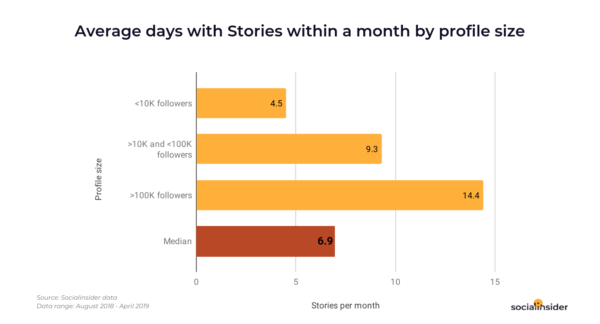
- Days with Stories within a month
#3. The most efficient Stories frames during the day is up to 6 Stories
This plays with retention rate on Stories. The retention rate metric is calculated by simply dividing the percentage of the impressions of the last story of the day by the impressions of the first Story within the same period of 24-hours.
The higher this metric is, the more engaged your audience is, the better chances you have for growing your brand awareness on Instagram.
The research has found that after 6 stories within a day, this retention rate drops below 70%, which makes it not efficient to further post Stories.
In addition, this extensive study also indicates that Instagram business pages on average are losing 15% of the audience watching their Stories after the audience goes into the second Story of the same day.
The insight to take out of this is simple. Do not post longer than 6 Stories length Stories on any given day, and keep in mind that fewer and fewer people will tune into your Stories after they watch the first one.
You can ensure to achieve a larger retention rate by posting the first Story which has a strong impact and leaves an impression to your audience.
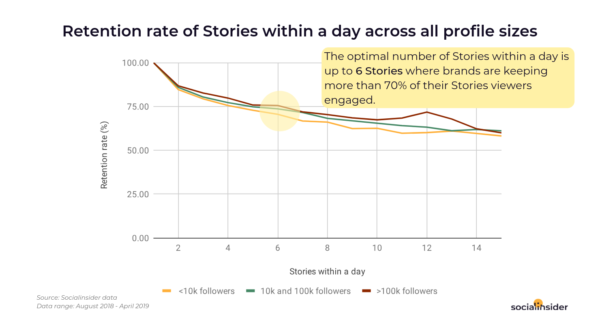
- Instagram Stories retention rate
#4. Smaller business pages reaches more followers with their Stories
In this research, the reach rate was calculated by dividing Story views by total followers.
The results indicate that brands with a following smaller than 10,000 reach about 9% of their audience with published Stories.
This reach is 4% higher than business pages with audiences between 10,000 and 100,000 followers.
Use this insight if you have a small business page and publish quality Stories, to reach more people and generate leads.
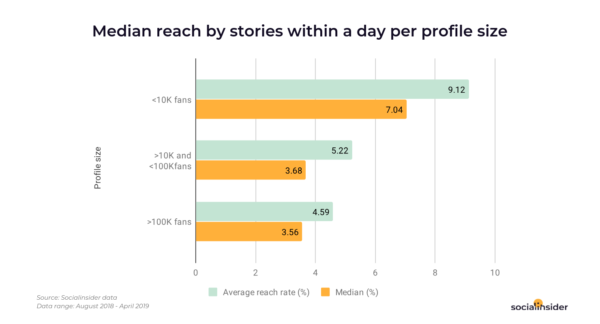
- Instagram Stories median reach
#5. Impressions and reach are influenced by the Stories posting length
The more Stories posted within a day, the bigger impression and reach metrics you can expect. It works universally with business pages of any size.
Just remember that there is optimal Stories length, and you might get diminishing returns.
On the other hand, if you have enough resources and want to grow your brand, use this insight in your favor.
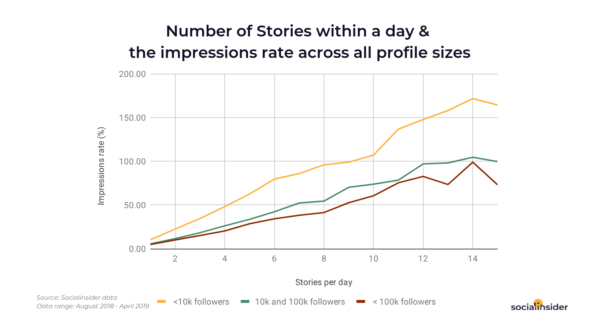
- Instagram Stories impressions rate
#6. Images perform better than videos in tap-forwards metric
Tap-forward rate is measured by the percentage of your audience who goes to the next Story after seeing yours.
The Stories data shows that images have a higher tap-forward rate than videos by about 5.65%. This is another benefit of videos performing better than images in Stories.
#7. Brands with audiences of less than 10,000 followers do not retain their audience using Stories
This is explained by the exit rate, which shows to what level the content in Stories engages the audience.
It is calculated as a percentage of the impressions on a Story which left it by exiting out of Stories. The research indicated that pages with less than 10,000 followers have on average a 7.43% exit rate. This is almost twice the percentage of the median rate of analyzed business pages on Instagram.
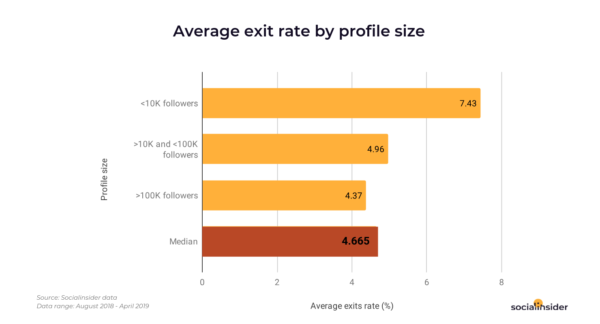
- Instagram Stories exit rate
#8. Pictures in Stories get more drop offs
As previous points have shown, videos are better at keeping your audience engaged.
To further that point, the research has also shown that audiences usually leave pictures more commonly than the videos on Stories.
#9. The 3rd and 4th Stories have the highest drop within a day
Business pages with an audience of fewer than 10,000 followers on average have exit rates of 17%, compared to 10% for pages with more than 100,000 followers. In addition, the highest drop rate usually occurs at around 3 and 4 Stories within a day.
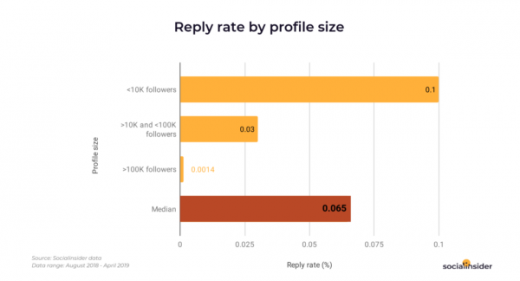
#10. The average reply rate on Stories is 0.06%
Reply rate in this study was calculated by a percentage of viewers of your Story who left a reply on it. Keep in mind that only direct messages are calculated, so reactions, interactions, and comments do not go into the reply rate. Such a low reply rate is nothing to worry about though, as other metrics mentioned in previous points are way more important to growing your brand on Instagram.
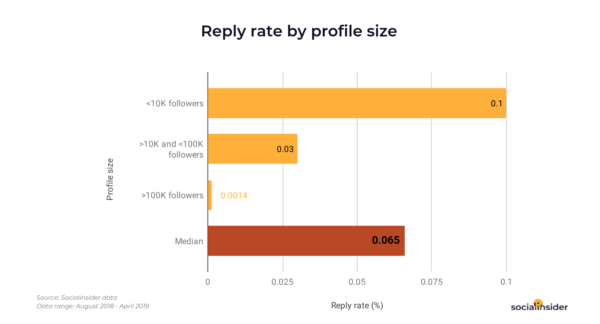
- Stories reply rate
Digital & Social Articles on Business 2 Community
(52)

