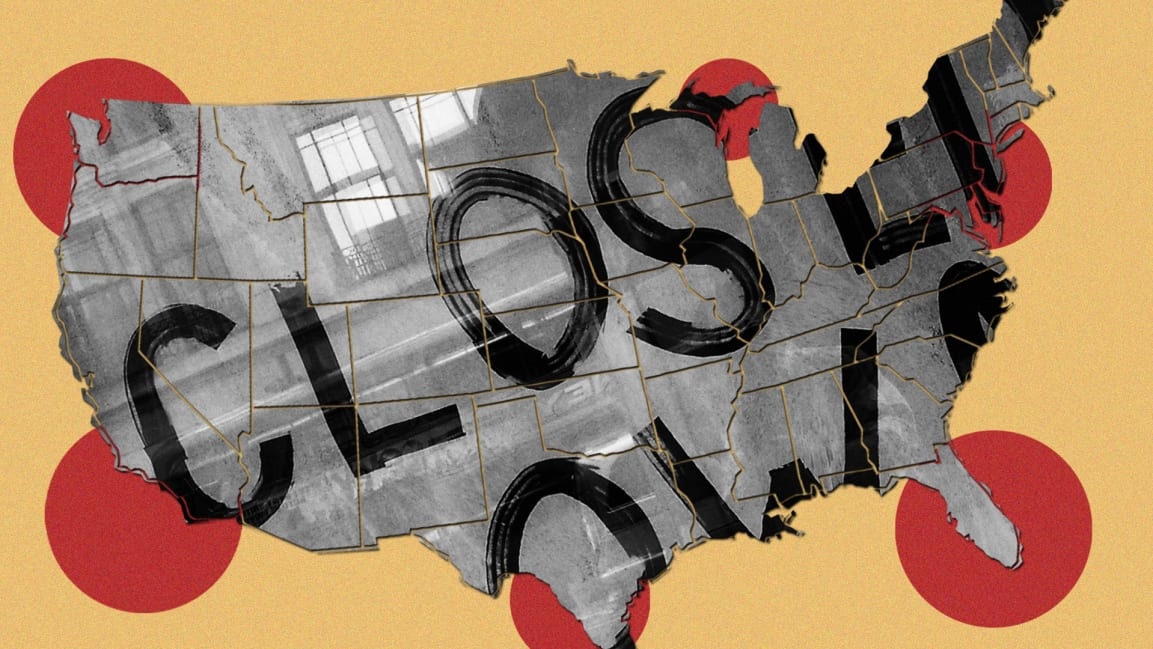
This unemployment map shows how millions of job losses are impacting each state
Another Thursday means another unemployment report from the U.S. Labor Department, in a grim weekly ritual that was scarcely noticed in more idyllic times. The latest developments: Nearly 3 million more Americans filed for unemployment benefits, bringing the total number of coronavirus-related job losses to almost 36.5 million.
But job losses haven’t hit states equally, notes WalletHub. The personal finance website has compiled data on unemployment claims in the 50 states plus the District of Columbia and produced a wide-ranging report comparing the impact on their workforces. The report (and its associated interactive map, embedded below) shows which states have seen the biggest increases in unemployment year over year, since January 2020, and since the start of the coronavirus pandemic, which WalletHub determined to be March 16 in the U.S. (Georgia, for example, has seen a 4,933% surge in claims since that date).
The report also compares the impact on red states as opposed to blue states and pits coronavirus job losses against Great Recession job losses (coronavirus takes the top spot—by a lot).
Check out the full report here.
(7)


