Visualizing where rich and poor people really cross paths–or don’t
The two coffee shops occupy the exact same block in Boston. Yet while they’re just a couple minutes walk apart, each serves a different mix of clientele. The first spot caters to people from many different income brackets, but the second caters almost exclusively to people with lower-income levels.
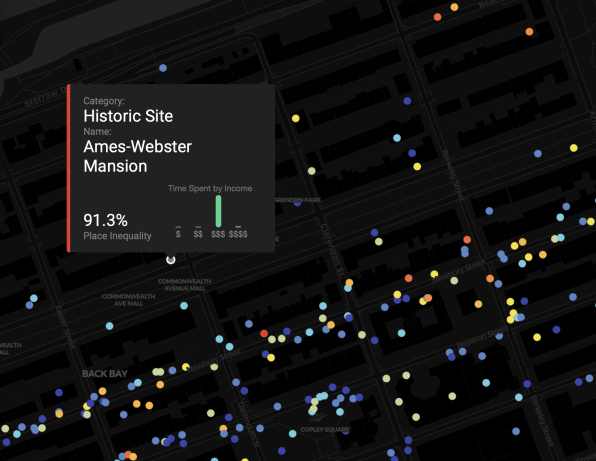
That’s an example of “place inequality”–a metric that measures how people of different income, rich and poor alike, tend to cluster in some public spots either because they feel more comfortable there (or perhaps are excluded elsewhere).
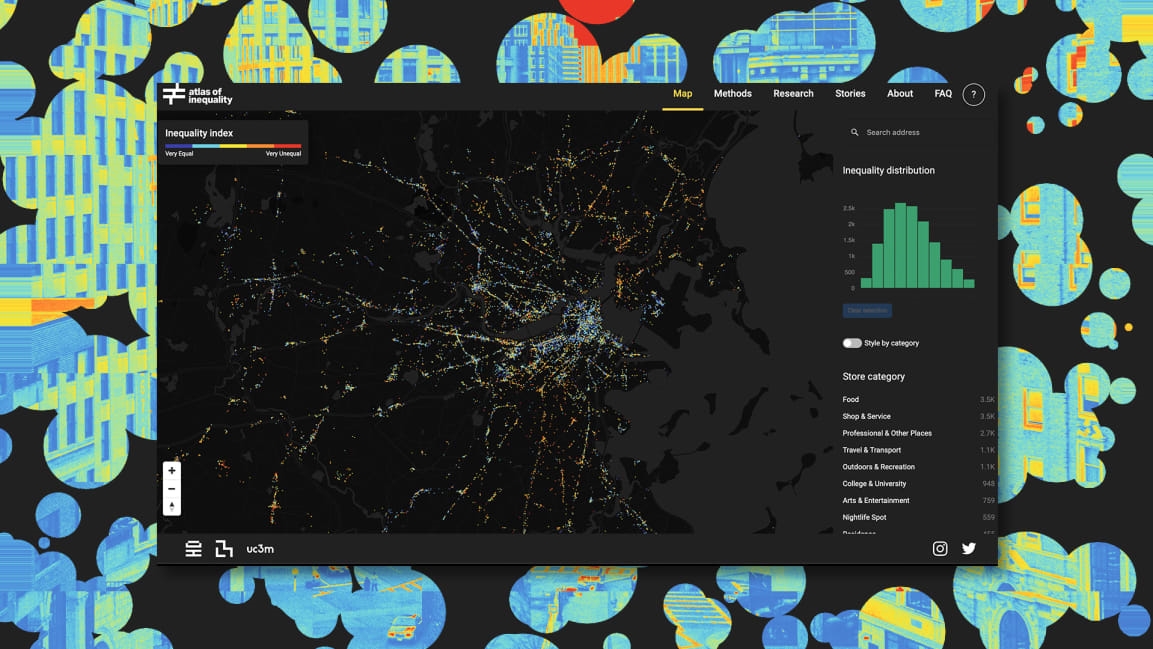
It’s an idea that’s hard to visualize unless you can see it on a map. So MIT Media Lab collaborated with the location intelligence firm Cuebiq to build one. The result is called the Atlas of Inequality and harvests the anonymized location data from 150,000 people who opted in to Cuebiq’s Data For Good Initiative to track their movement for scientific research purposes. After isolating the general area (based on downtime) where each subject lived, MIT Media Lab could estimate what income bracket they occupied. The group then used data from a six-month period between late 2016 and early 2017 to figure out where these people traveled, and how their paths overlapped.

The result is an interactive view of just how filtered, sheltered, or sequestered many people’s lives really are. That’s an important thing to be reminded of at a time when the U.S. feels increasingly ideologically and economically divided. “Economic inequality isn’t just limited to neighborhoods, it’s part of the places you visit every day,” the researchers say in a mission statement about the Atlas.
As the Atlas’s instructions make clear, users can zoom in to see color-coded representations clustered at different coffee shops, movie theatres, stores, and restaurants around the city. (More than 30,000 places were identified by using a public application programming interface from FourSquare.)
Take, for instance, the coffee shop, which is called out in a section examining “stories” the groups uncovered. “Through these choices we build our habits and routines,” the researchers write. “The fact that our routines decide where we spend our time also means they decide who we spend our time with.” Providing people with a tool to recognize that is a good thing. Perhaps businesses and cities alike will see the benefit of building more intentionally inclusive spaces which within everyone can interact.
Fast Company , Read Full Story
(21)


