7 Google Analytics Reports to Help You Manage Your Site
Managing your site and its traffic can feel overwhelming, especially with so many Google Analytics tools available. That’s why the reports available via the Analytics platform should be your go-to starting point. By asking the right questions and using the right reports you can build up a picture of what’s working and what isn’t.
If you want to know what content works for you, what platforms people encounter you through or if your ad campaigns are working, Google Analytics reports can help you find out. But what are the right reports? We’ve picked out seven to get you started.
Site Speed
The first thing to check is that your site is actually accessible. All the marketing, strategising and great content in the world won’t help a site that doesn’t load. By tracking the site speed on different devices and browsers, you can ensure people don’t click away before ever seeing your page.
Whilst the report won’t tell you what’s causing the problem, it can tell you which pages it’s on. If it’s only on a few, you might find it’s a certain kind of content – large images, videos or audio files are common offenders. You can then avoid using them on major landing pages.
If your whole website’s slow, it’s more likely to be an issue with the underlying code. It could be something such as unoptimised CSS or Javascript. Luckily, you can use the reports to narrow it down by adjusting the site and running it again!
Of course, some people do still use very old versions of browsers, so you may not be able to optimise for everyone. Still, by running this report regularly, you can make sure that people actually reach your website before giving up.
Browser and Device
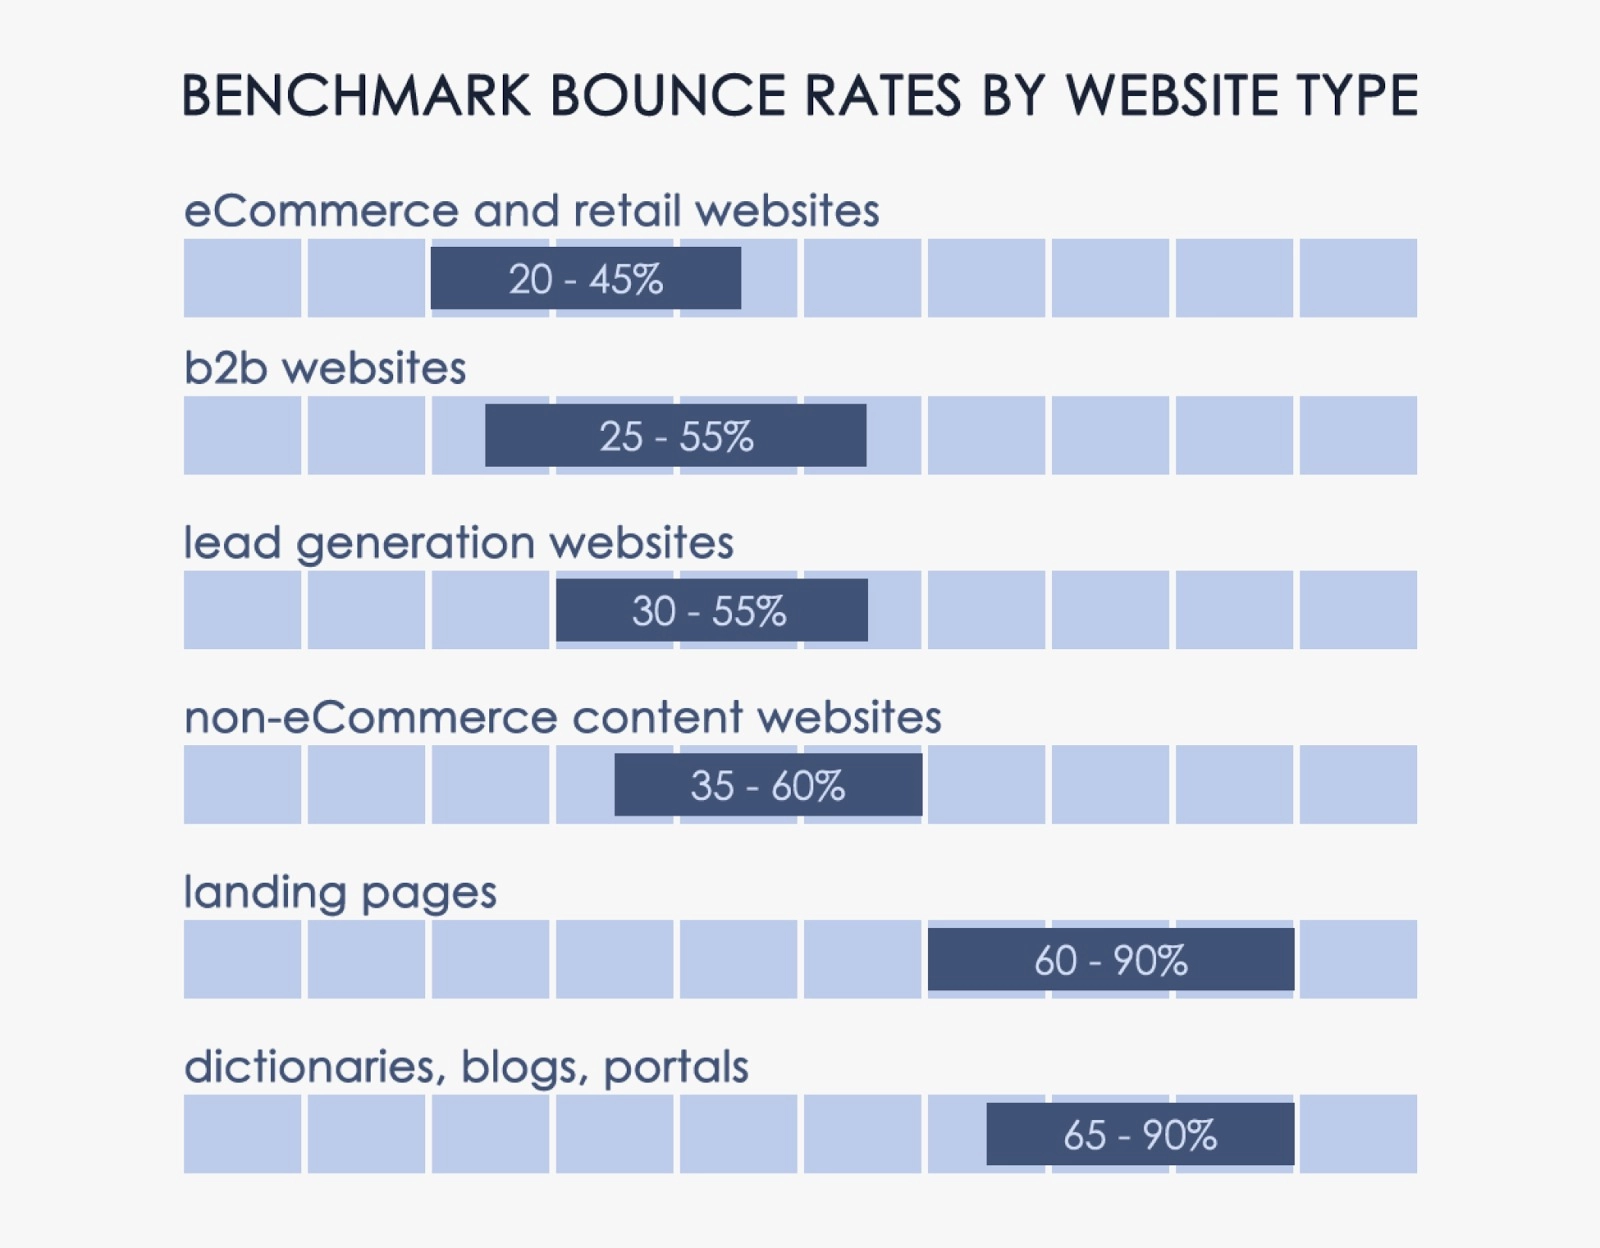
While you’re never going to reduce your bounce rate to 0%, you do want to reduce it as much as you can. The image below gives an expected bounce rate for different types of website, so if your bounce rate is much higher, then there’s a problem.

With something like a dictionary, people will be looking for a single definition. So, when they’ve found it, they’ll move on. Having a high bounce rate here is fine. But for a retail site, you want customers to explore and look at multiple products. A high bounce rate, there, is bad to say the least.
You can use a Google Analytics report to keep an eye on bounce rates by browser and device. That allows you to make sure that there’s nothing affecting customer experience on one particular platform.
The bounce rate on mobiles is usually higher, so a slight increase is to be expected. However, if there’s a huge discrepancy you might need to ensure your site is suitable for mobile. The same applies to browsers. If you have an average bounce rate of 40% on Internet Explorer and Chrome, but 75% in Firefox, it can mean your website is incompatible with the browser and it’s time to fix it.
Once you’ve resolved any technical problems that might be impacting bounce rate, you can start looking at the content of your site itself.
Content Efficiency
As I mentioned, another great way to reduce your bounce rate is to ensure your content is working for you. But how can you tell whether it is? There’s a Google Analytics report for that! By tracking page views, bounce rate, and the time spent on a page, we can build up a picture of what content is keeping peoples’ attention the most.
You can find out which topics people engage with the most, whether text, images or videos do better for you, and if there’s anything that’s worth cutting entirely. This report is essential for building up a useful, engaging stream of content, and helps you focus on what’s bringing you the best results. From there, you can create a content strategy. Just make sure you’re prepared to reassess if the results change over time!
Remember, just because something is the main draw doesn’t mean it should become your only focus. If 50% of users are reading long-form text posts, and 30% are engaging with image-based content, you should keep doing both. Then, you can look into ways you might be able to draw people from the text to the videos.
Hours and Days
It’s not just what content you’re putting on, but when. Ever had that annoying experience of uploading something fantastic, only for the response to fall short of expectations? That could because it’s been posted at the wrong time of day. By tracking when users are most often active on your site, you can lean into the busy times and make sure new content is seen by the most people.
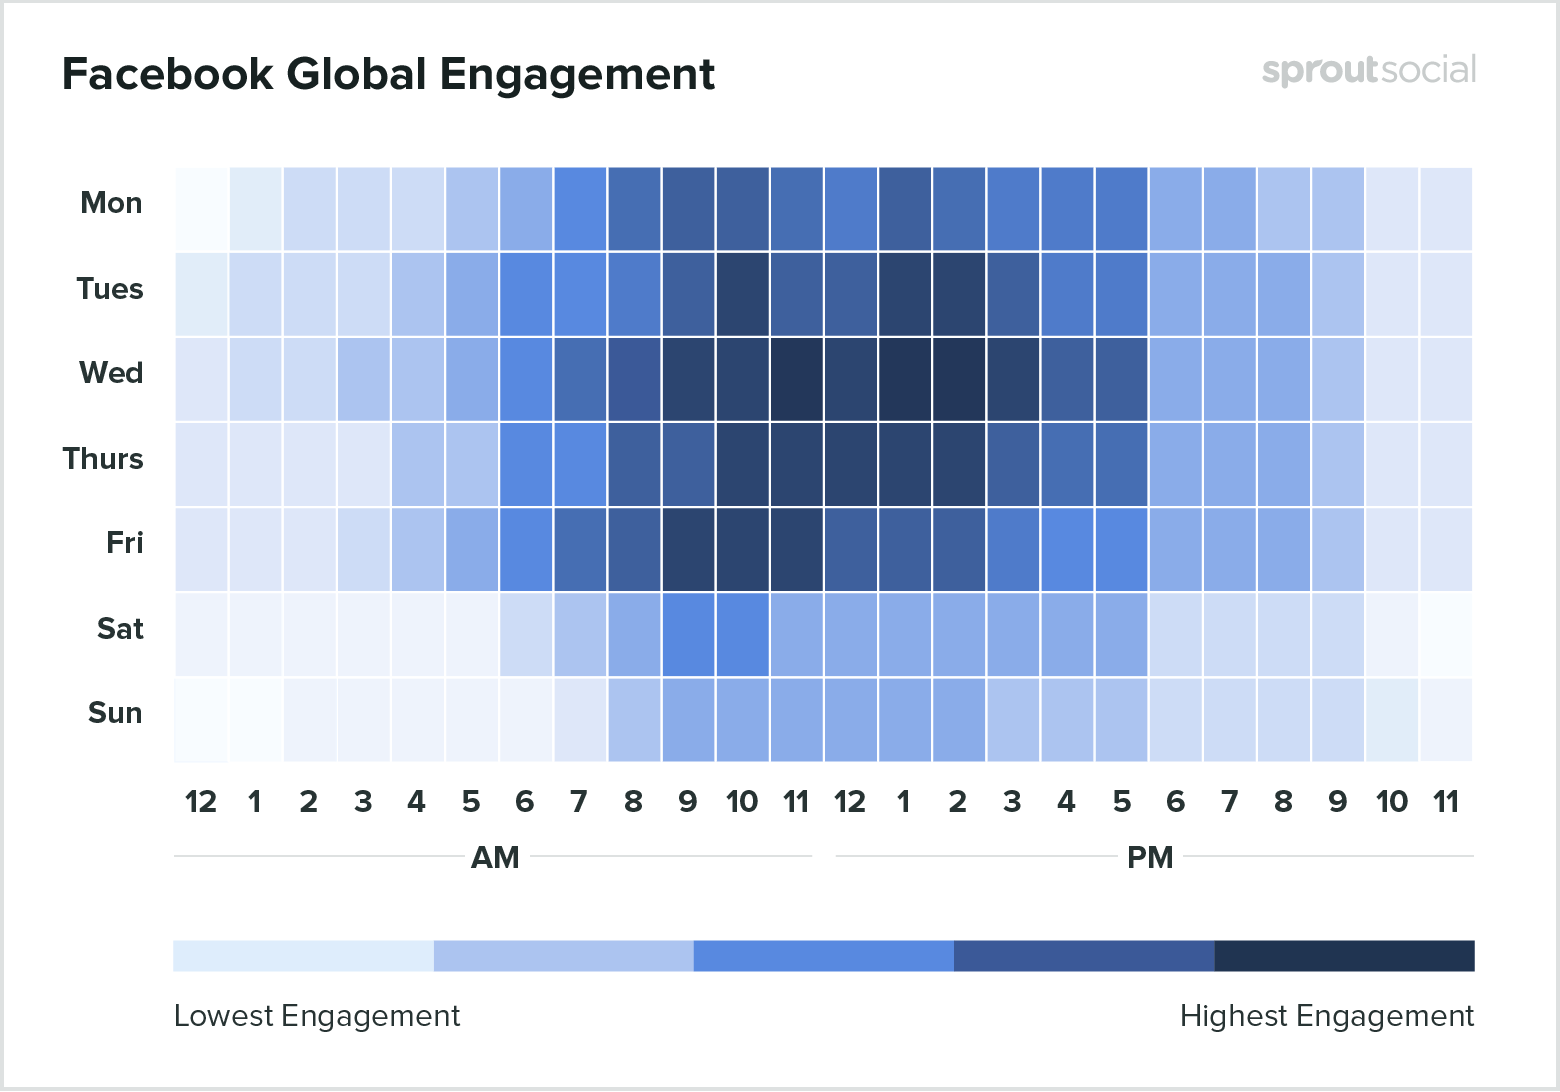
This is something you should set up early and track over an extended period of time. It’s possible a week’s worth of data might be influenced by a one-off event. Build up a report over a few months, however, and you’ll have an accurate image of when your website gets used. Ideally, you want to build up something similar to the data below, but focused on your own website rather than social media.

Referral Pages
If you’re running any form of marketing campaign, you’ll want to make sure it’s working. A great way to check this is to run a report based around referrals. That basically means where traffic is coming from, and if that traffic is hitting the goals you want. I’d recommend separating this out from social media traffic (which we’ll come to next) because they often require different strategies.
By tracking where your traffic is coming from, you can keep an eye on whether any paid ad campaigns are working. This can help you narrow down a broad, almost scattershot approach to something more targeted and efficient. That’s an excellent way to save a lot of money in the long run.
You might find that certain approaches are more effective than others. For instance, your SaaS marketing strategy might involve referral-based marketing – getting current customers to talk about what you do. This report can show you which customers drive the most traffic to you, allowing you to adapt your marketing strategy accordingly.
You can also see if there’s anywhere that’s organically driving traffic towards you. If you notice an uptick in traffic from a new source, it may be worth actively contacting the source to work with them in the future.
Social Media Traffic
Similar to the last report, this focuses on traffic sources – in this case, social media sources. We’re often told that social media is the future, but it can be tricky to tell whether engagement on social media translates into sales. By tracking sources, where they land, and their goal conversion rate, you can start to get a good idea of whether something is working the way you hoped.
After all, there’s no point putting a lot of effort into carefully crafted long-form posts on Facebook if they don’t result in any goal conversions! Equally, it’s no use making a fascinating infographic and then posting it when all your users will be asleep. You can use this report alongside the hours and days one to hit the most effective times to post.
There are two useful things you can take away from this data. Firstly, knowing where your audience is coming from will help you with returning customers and maintaining engagement. Secondly, knowing where your efforts are going unnoticed will help you change direction rather than wasting your time!
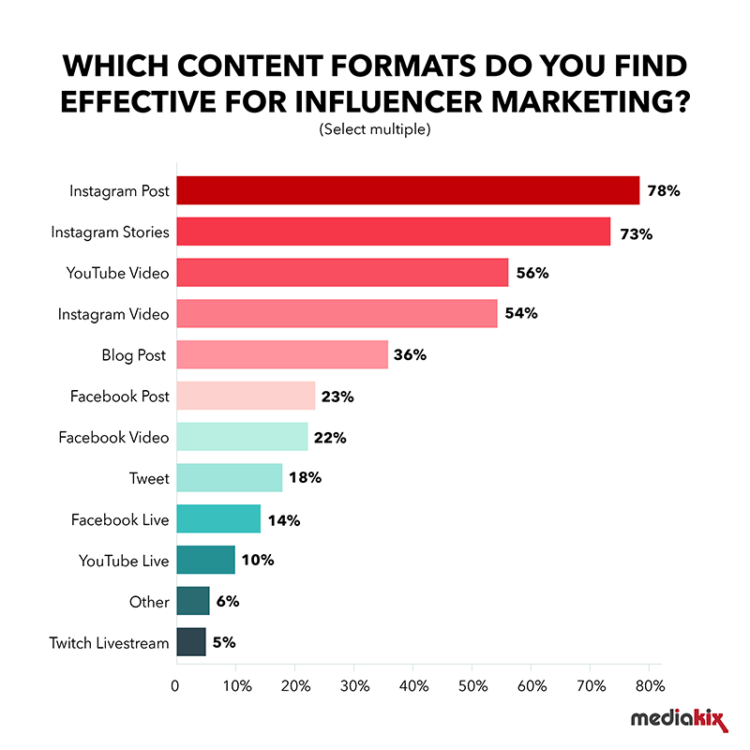
This is particularly important if you plan to do influencer marketing, as the type of post can have a huge effect on its impact. You can see from the data below that even on the same platform – Instagram – different styles of content produce different results.

Keywords
If you’re running a website, you’ve probably been told to optimise your keywords. But how do you know which keywords to focus on? By running a report on what keywords are already working for you! Whilst some are encrypted by Google, it’s still possible to track those that are available.
It’s also worth doing extra keyword research by expanding your scope beyond the usual one or two-word phrases and exploring the impact of long-tail keywords. With voice search becoming more common, people are inclined to ask full questions, instead of typing in an abbreviated form. It’s worth checking whether you should put more focus onto these longer phrases, or whether to keep to the usual shorter format.
So What Now?
It can be tempting to look at all the possibilities and charge straight in. We recommend taking it a little slower and playing around with the data to figure out what you need. Rather than looking at all possible reports, keep it simple and shore up the foundations before starting anything new. With these seven reports, you should be able to build up a strong image of what’s working for your website and what isn’t.
Once you have that in mind, take the time to explore what else you can use Google Analytics reports for. They’re an incredibly powerful tool, and definitely worth exploring as you grow your site.
Digital & Social Articles on Business 2 Community
(31)


